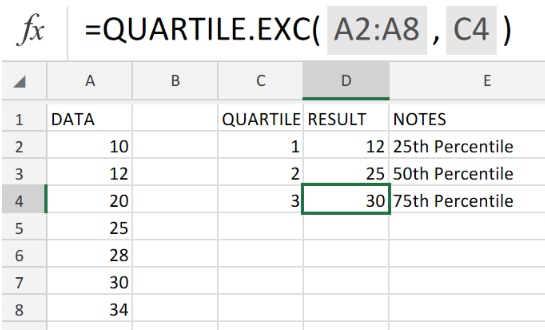
Figure 1. Excel QUARTILE.EXC Function
If our goal is to obtain the quartile in a data set of (three separate percentiles), we must utilize the Excel QUARTILE.EXC function.
Generic Formula
=QUARTILE.EXC(array, quart)
• array = data reference to analyze.
• quart = value of quartile to be determined
The Excel QUARTILE.EXC function is categorized as an exclusive percentile and has “a greater than” behavior.
How to use the Excel QUARTILE.EXC Function.
We are sometimes required to determine the minimum or maximum profits in 1st or 2nd quartiles for given figures during financial analysis. The QUARTILE.EXC Function in Excel is specifically designed for such calculations.
Use 3 simple steps described below to achieve this;
- Arrange all the data references for analysis in a column of our worksheet. Be sure to make provision for Excel QUARTILE.EXC Function to return the resulting number values.
See example illustrated below;
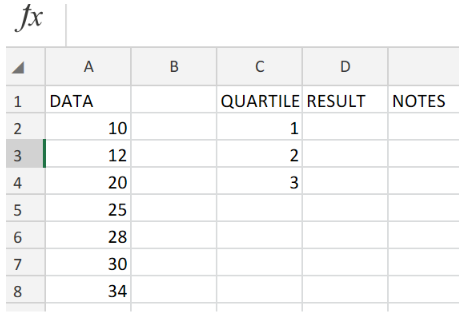 Figure 2. Excel QUARTILE.EXC Function.
- In our worksheet example above, the QUARTILE.EXC formula we will enter into cell D2 is as follows;
=QUARTILE.EXC(A2:A8,C2)
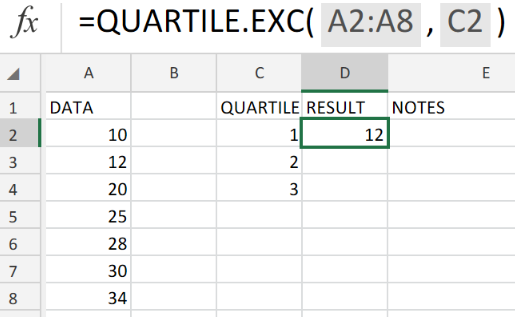 Figure 3. Excel QUARTILE.EXC Function.
Excel returned the percentile value as 12 for the data referenced in cell A2.
- To get the other percentile values, modify the QUARTILE.EXC formula in cell D2 and enter into the other cells in the RESULT column.
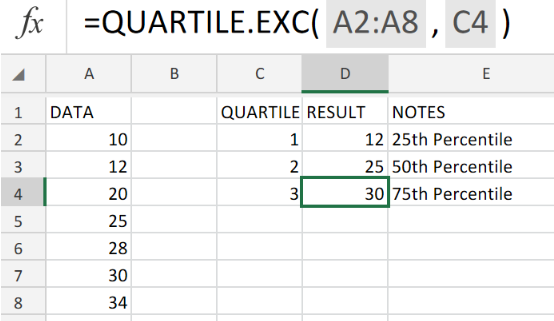 Figure 4. Excel QUARTILE.EXC Function.
Percentiles are often used in surveys and sales data for dividing populations into groups.
The Excel QUARTILE.EXC formula is a statistical function.
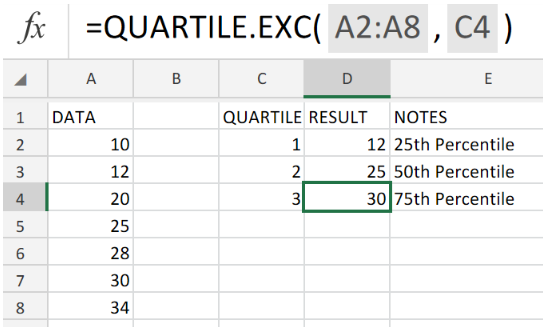 Figure 5. Final Result.
Instant Connection to an Expert through our Excelchat Service:
Our live Excelchat Service is here for you. We have Excel Experts available 24/7 to answer any Excel questions you may have. Guaranteed connection within 30 seconds and a customized solution for you within 20 minutes.


Leave a Comment