

Sensitivity reports can be generated after using the Excel Solver add-in. Solver, like Goal Seek, is very useful in various fields of study and application. Solver is a What-if-Analysis tool that solves for an optimal value in the target cell by changing the values in the variable cells.
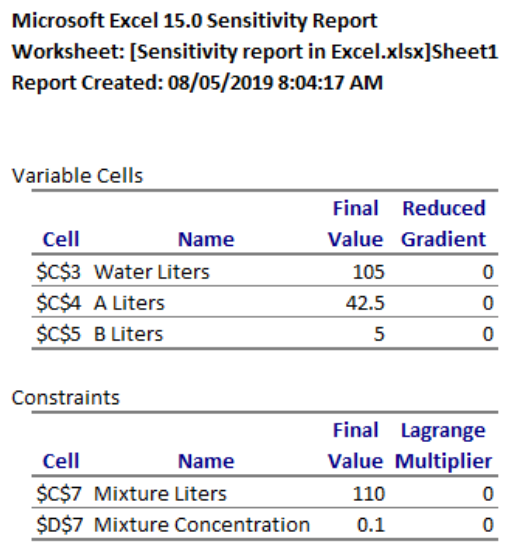 Figure 1. Final result: Sensitivity Report
Where is Excel Solver?
Goal Seek can be accessed through the Data tab > Solver button
 Figure 2. Solver command button in Data tab
Prepare our data
Suppose we want to prepare a mixture in a laboratory, using water and two chemical reagents A and B. The concentration of the mixture is given by the formula
=(C4*D4+C5*D5)/C7
which can be interpreted as the sum of volume of the pure chemicals divided by the volume of the whole mixture.
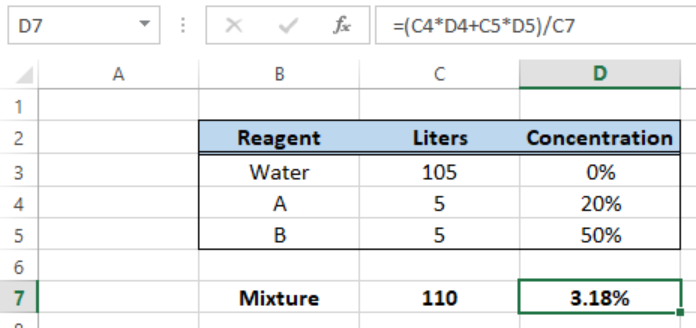 Figure 3. Sample data for Sensitivity Report
Our goal is to obtain a mixture concentration of 10% by determining the required volume of the reagents, with the concentration of each reagent remaining constant. We have the following constraints:
- The volume of the whole mixture must still be equal to 110 liters
- The available stock for reagent B is only 5 liters
How to generate a sensitivity report?
We must first use the Excel Solver Analysis and after we have performed the calculation, we can then generate the sensitivity report. We follow these step-by-step procedure:
- Click Data tab > Solver button
The Solver Parameters dialog box will appear.
 Figure 4. Solver Parameters dialog box
- Enter the following information needed by Solver as shown below:
-
- Set objective: D7
- To: Value of 10%
- By changing variable cells: C3:C5
- Subject to the constraints: C5<=5
C7 = 110
-
 Figure 5. Entering the values
- Click Solve
- The Solver Results dialog box will appear. Tick Keep Solver Solution and under Reports, select Sensitivity. Click OK.
 Figure 6. Sensitivity Report option in Solver Results
The time it takes for Solver to complete the calculations might vary depending on the complexity of the problem.
The optimal solution will then reflect in cells C3 to C5 in our worksheet (Sheet 1 below). The Sensitivity Report will be generated in another worksheet named Sensitivity Report 1.
 Figure 7. Excel Solver optimization results
This is how a Sensitivity Report is presented:
 Figure 8. Output: Sensitivity Report
How to interpret a sensitivity report?
The sensitivity report shows the names, corresponding cells and final values of the variable cells and constraints. The value of the Lagrange multiplier is a measure of the sensitivity of the constrained objective to changes in the constrained variables. Excel Solver offers other sensitivity reports and we can further explore this analysis tool to solve more complicated optimization problems and generate more detailed reports.
Instant Connection to an Excel Expert
Most of the time, the problem you will need to solve will be more complex than a simple application of a formula or function. If you want to save hours of research and frustration, try our live Excelchat service! Our Excel Experts are available 24/7 to answer any Excel question you may have. We guarantee a connection within 30 seconds and a customized solution within 20 minutes.


Leave a Comment