

Excel has a built-in chart type called pie of pie chart. It is actually a double pie chart, which displays the parts of a whole through a main pie, while also providing a way to represent the minor slices through another pie. This chart makes the pie chart less complicated and easier to read.
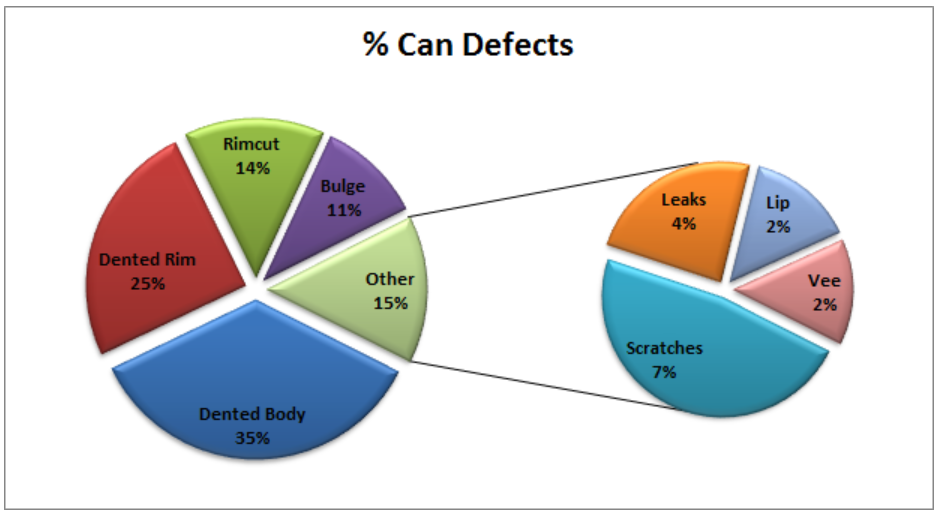 Figure 1. Final result: Pie of pie chart
How to create a pie chart?
Just like any chart, we can easily create a pie chart in Excel version 2013, 2010 or lower.
- First, we select the data we want to graph
- Click Insert tab, Pie button then choose from the selection of pie chart types: Pie, Exploded Pie, Pie of pie, Bar of pie, or 3D pie chart.
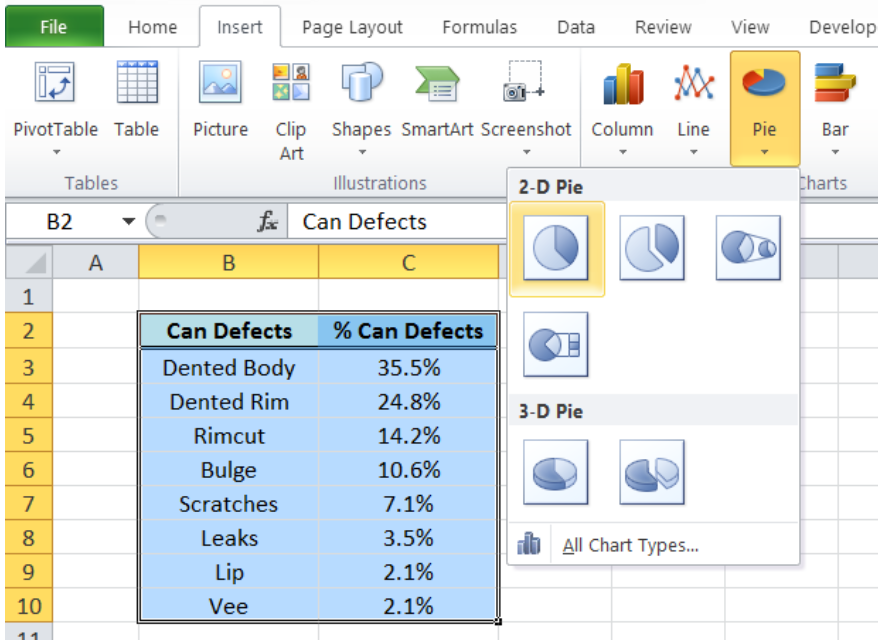 Figure 2. Pie chart selection
If we choose to make a 3D pie chart, it will look like this.
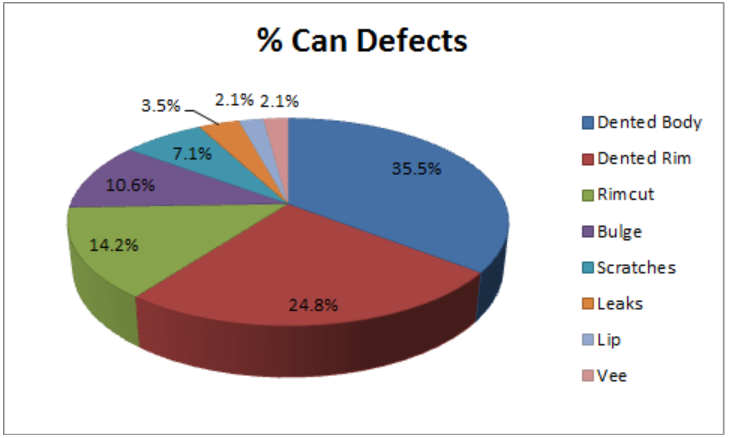 Figure 3. 3D pie chart
There are so many categories in the above pie chart, making it look complicated and harder to read.
Pie of pie chart
To improve the presentation of our data, we can create a pie of pie chart. Following the same procedure as the example above, we choose the chart type pie of pie and create the resulting graph below.
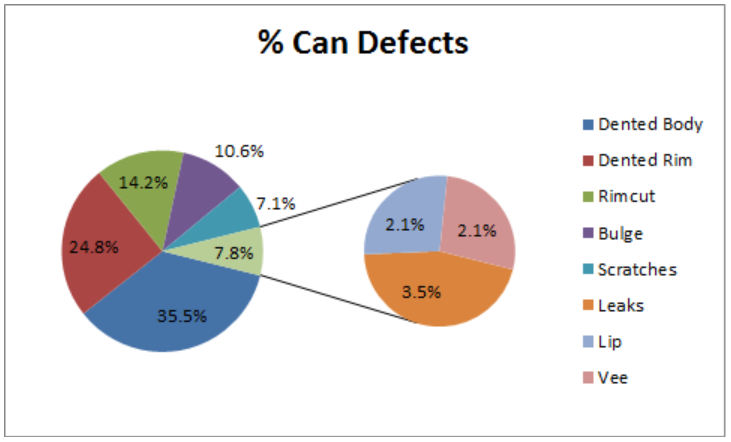 Figure 4. Pie of pie chart
We can launch Format Data Series by right-clicking the chart and selecting from the menu.
 Figure 5. Format Data Series option
We can then customize in Series Options.
Example
Set the following:
Split Series By: Percentage value
Second plot contains all values less than: 10%
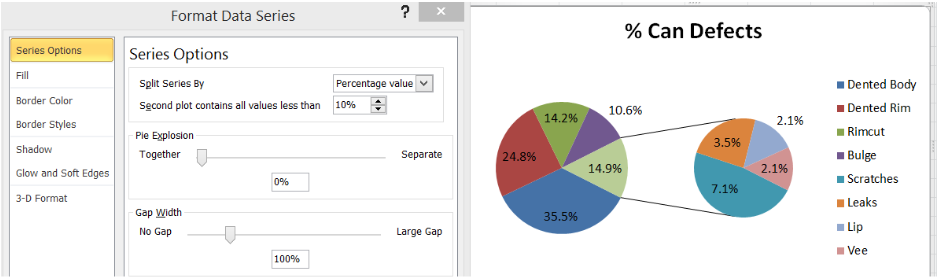 Figure 6. Customizing the pie of pie chart
How to explode a pie chart?
We can explode a pie chart in two ways:
- Directly pull the slice or slices apart
Example:
Pull the slice for Bulge and Lip away from the pie
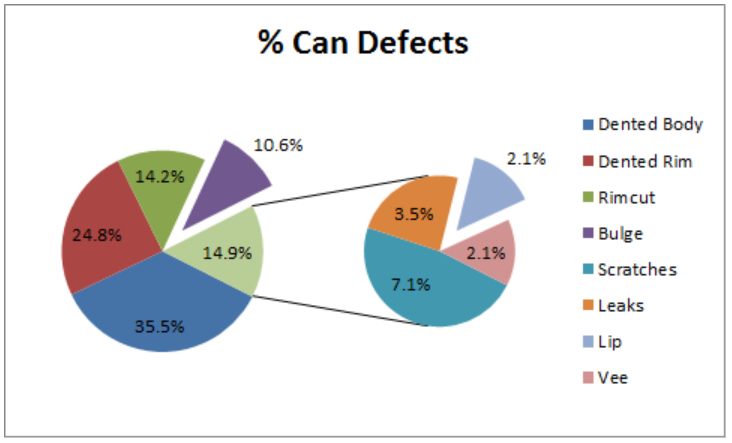 Figure 7. Exploded pie chart
- Series Options in Format Data Series
Example: Set pie explosion from 0% to 7%
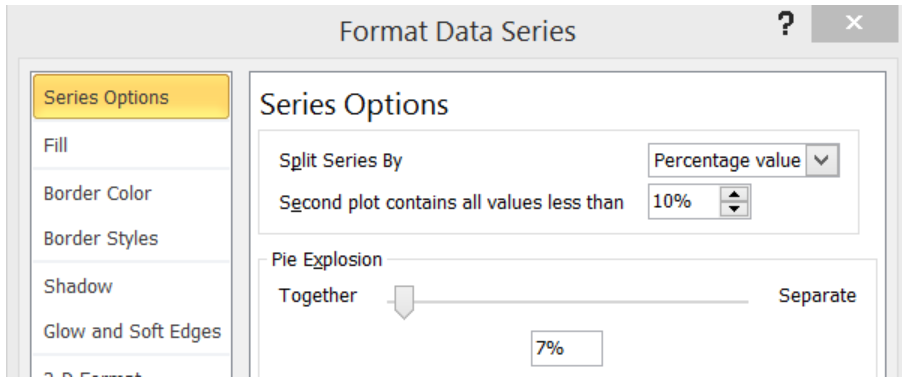 Figure 8. Customize pie explosion
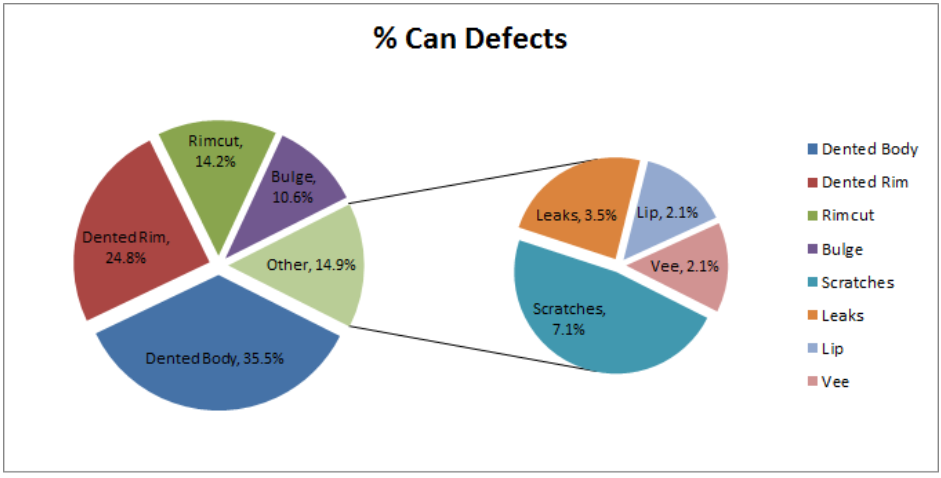 Figure 9. Output: How to explode a pie chart
Instant Connection to an Excel Expert
Most of the time, the problem you will need to solve will be more complex than a simple application of a formula or function. If you want to save hours of research and frustration, try our live Excelchat service! Our Excel Experts are available 24/7 to answer any Excel question you may have. We guarantee a connection within 30 seconds and a customized solution within 20 minutes.


Leave a Comment