
We use the F-test to decide the equality of two population variances. The F-test is also vital when carrying out the Analysis of Variance (ANOVA). In this tutorial, we will describe the F-Test function and show how we can do the F-Test in Excel.
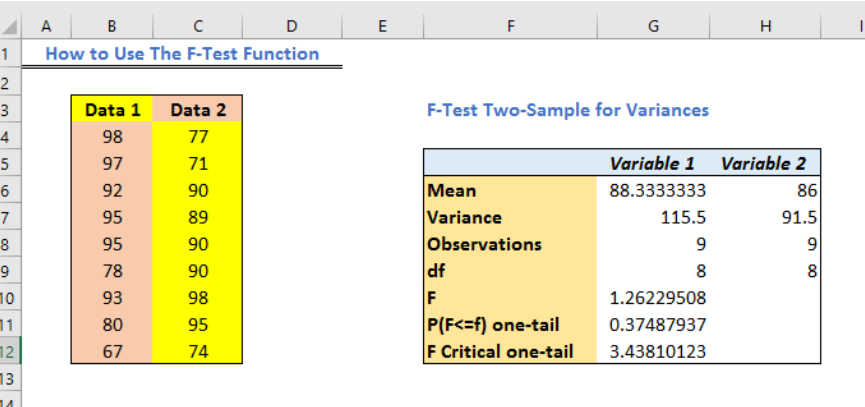 Figure 1 – F test example
How to enable the Excel F-test
We need the Analysis ToolPak add-in to use the F-test function. We can turn this feature on in our worksheet because this add-in comes pre-installed with our Microsoft Excel application. To enable the Analysis ToolPak;
- We will go to file and then select Options
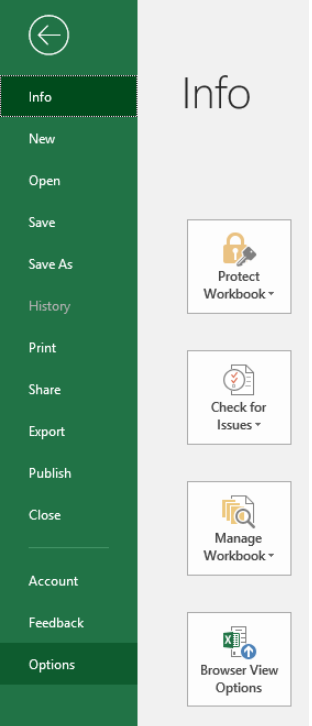 Figure 2 – How to do an f test
- In the Options dialog window, we will select Add-ins
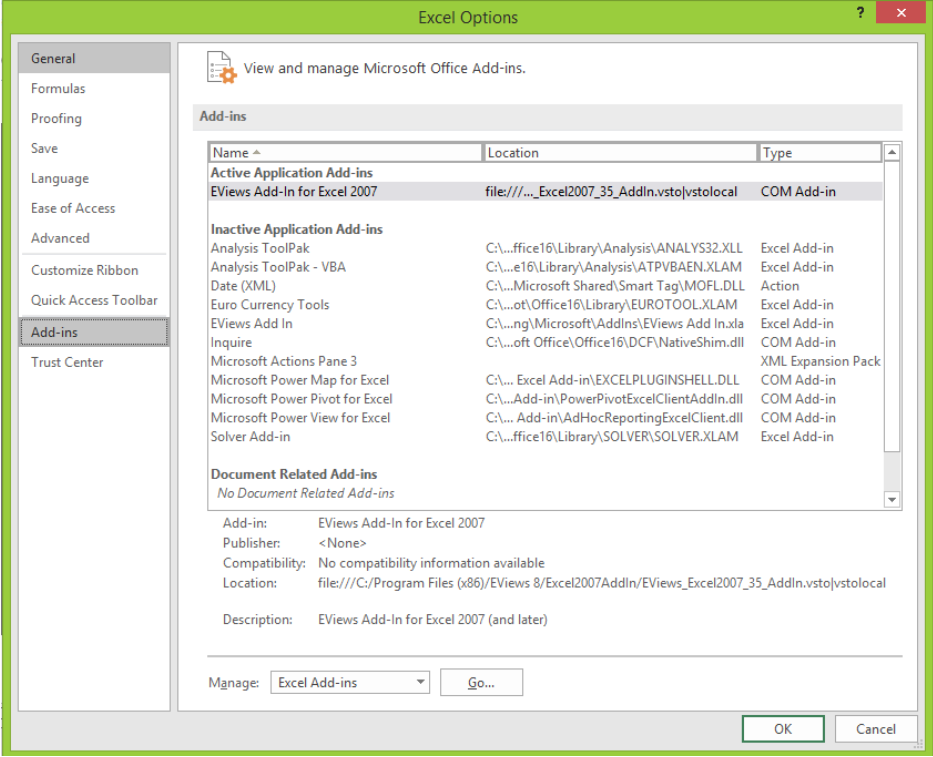 Figure 3 – F-test in excel
- In the Add-ins dialog box, we will click Analysis Toolpak and select OK.
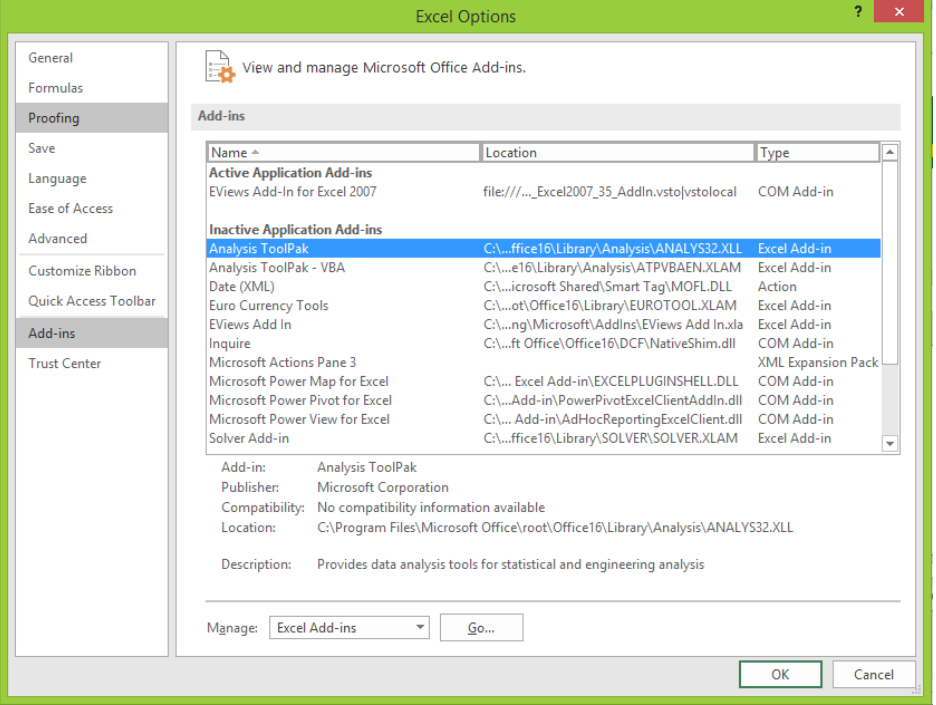 Figure 4 – How to do an f-test
How to do the F-test in Excel
- We will set up our data to carry out the F-test Analysis
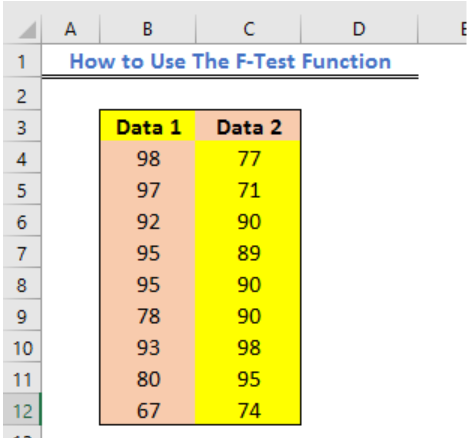 Figure 5 – Setting data for f test chart
- Next, we will go to the Data Tab and select Data Analysis
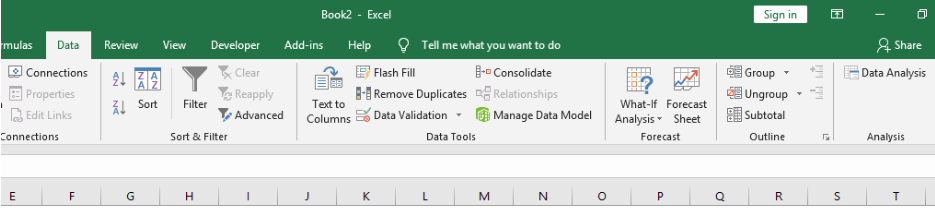 Figure 6 – F-test using Data Analysis
- In the Data Analysis dialog box, we will click on f-test two samples for variances and select OK to enable the function
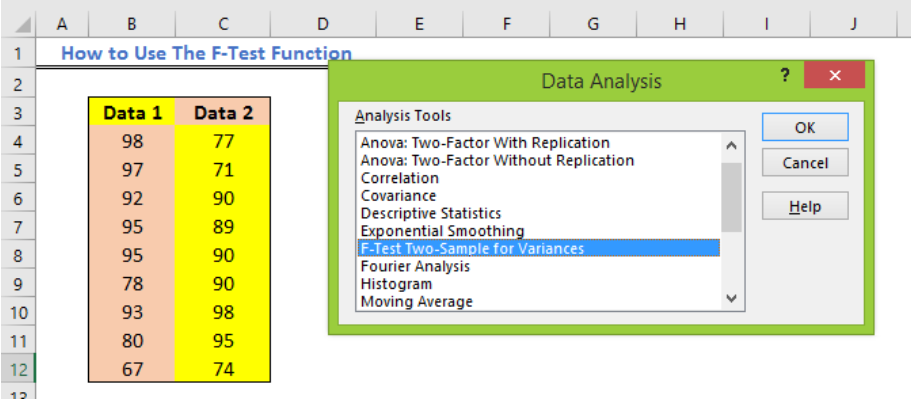 Figure 7 – F-test two sample for variances
- The F-test two samples for variances dialog box will come up.
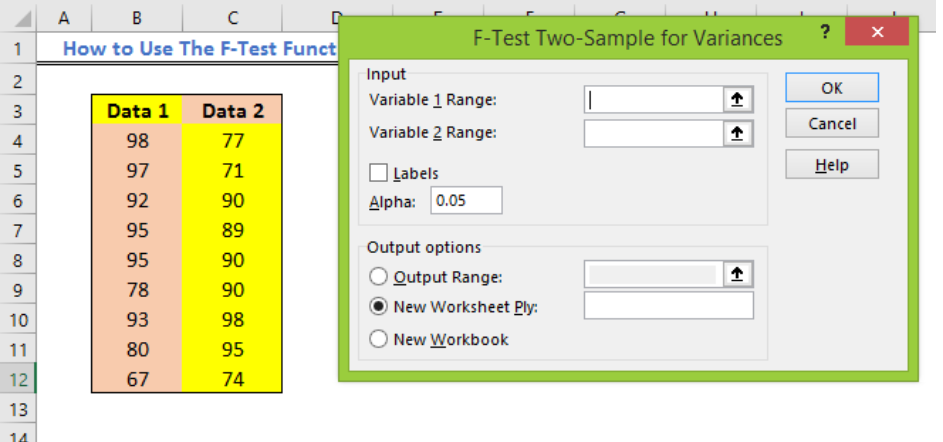 Figure 8 – F-test in excel
- Here we will enter the range for Variable Range 1 and 2. We will do this by:
- Clicking in the input section for Variable 1 Range followed by highlighting on the range of values
- Next, we will click on the input section for Variable 2 Range followed by highlighting the range of values.
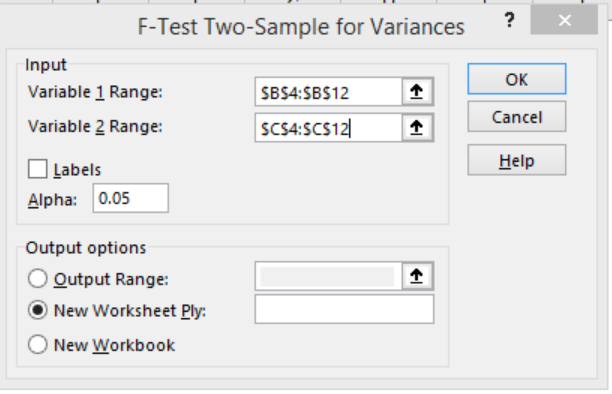 Figure 9 – F-test two sample for variances
- In the Output values section at the base of the dialog window, we will mark the output range and enter the space on our worksheet where we wish to see our results.
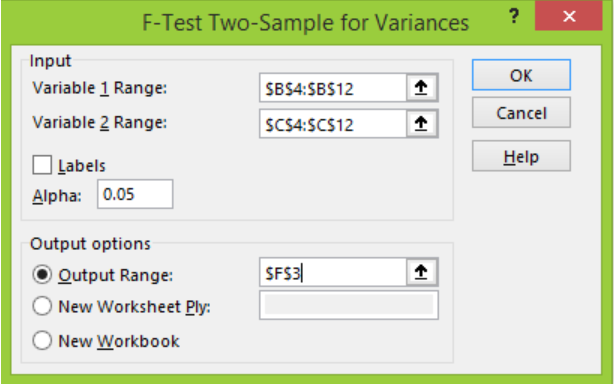 Figure 10 – F-test for variance
- Lastly, we will select OK. Our F-test will return with this result
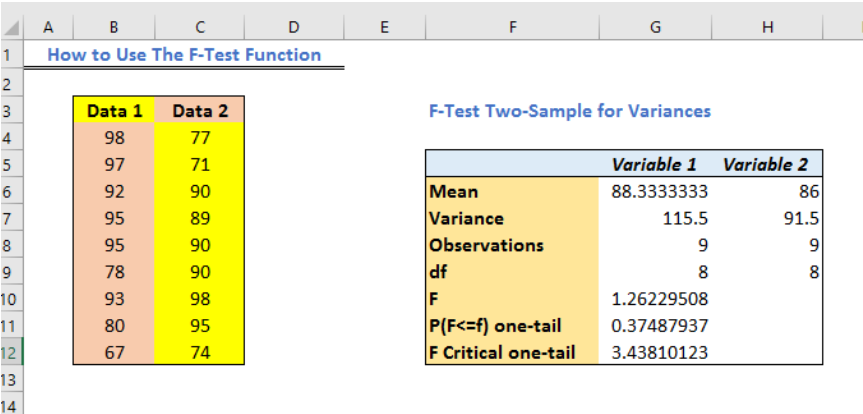 Figure 11 – How to do an f test
Note
FTEST(array1,array2)
Where: array 1 is the first data range or array; array2 is the second data range or array
- Arguments must always contain numbers (even when names or numbers are included)
- If the array contains text, empty cells or logical values, then the cells will be ignored
- Cells with values zero will be included.
- If the number of data points of array1 or array2 equal zero or array 1 or array 2 is less than zero, then the F-Test will return with a #DIV/0! error value.
Instant Connection to an Excel Expert
Most of the time, the problem you will need to solve will be more complex than a simple application of a formula or function. If you want to save hours of research and frustration, try our live Excelchat service! Our Excel Experts are available 24/7 to answer any Excel question you may have. We guarantee a connection within 30 seconds and a customized solution within 20 minutes.


Leave a Comment