

What is a Data Series in Excel?
A data series is a collection of consecutive values or numbers in a column on a spreadsheet. We can create data series by plotting a graph from an initial series of data, then, we can create another series of data and highlight it along with the pre-existing data series. This tutorial would teach us how to add data series to a spreadsheet.
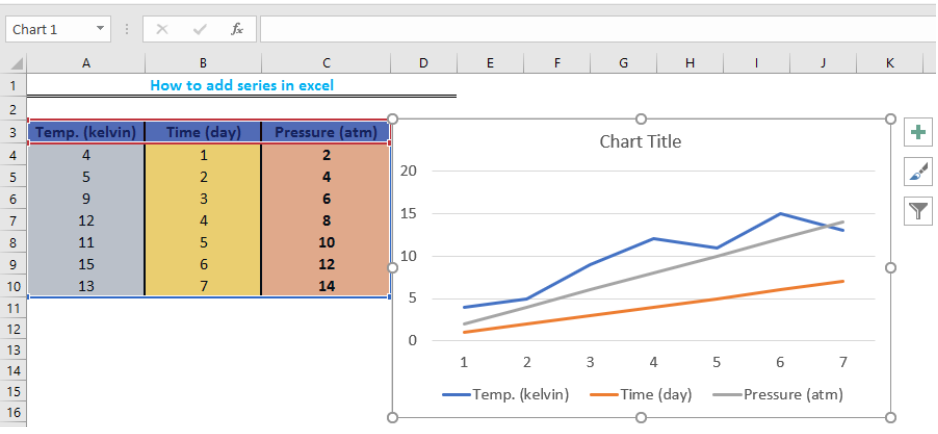 Figure 1: How to add data series in excel
How to Add Series in Excel
- To do this, we will tabulate our series of data and add the series name as title.
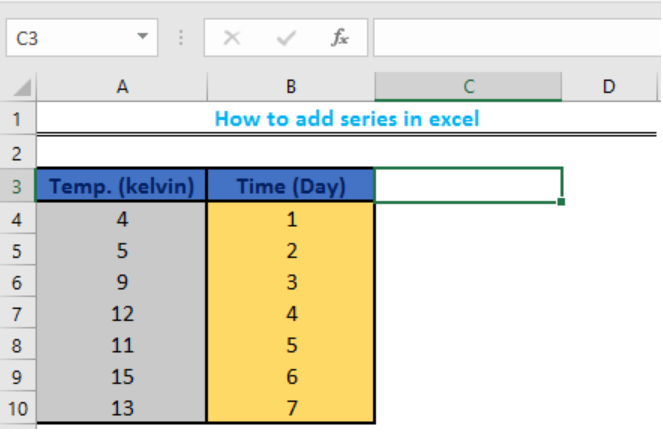 Figure 2: Data to create series in excel
- We will plot our chart with the data by clicking on insert and select a line chart
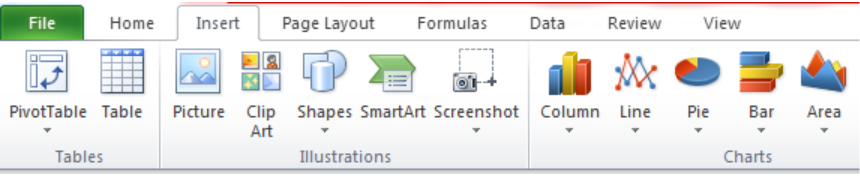 Figure 3: Click on Insert
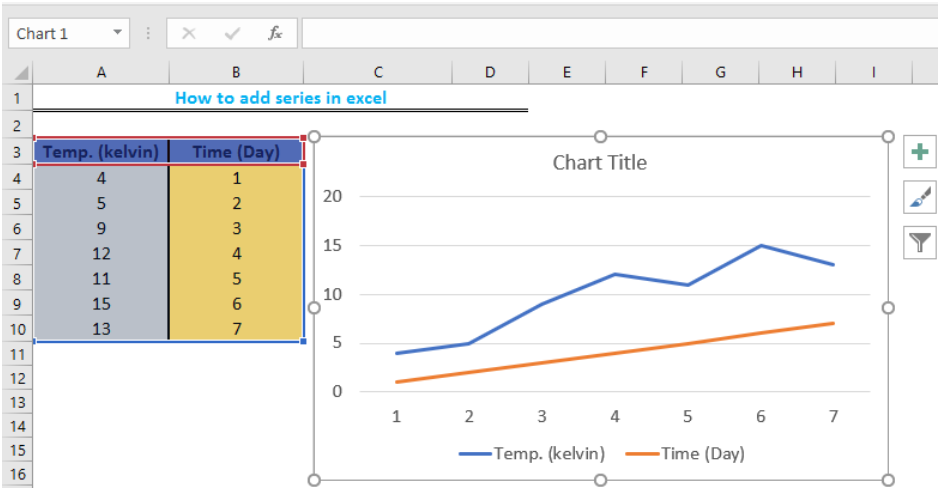 Figure 4: Line chart
- We will now create a column to add a new series of data
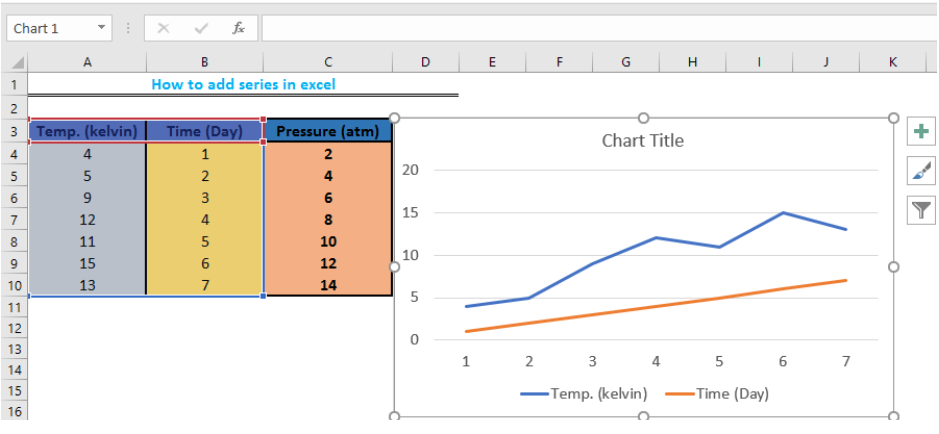 Figure 5: New set of data
When we click on the chart, it will highlight both the Temp. and Time columns, indicating the source of data. We will now drag the Fill handle (the box at the bottom-right when we click a cell) of the highlighted titles in Cells A3 and B3 over the new column created in Cell C3 to create the data series on the chart.
 Figure 6: New data series added to chart
- We can remove the data series from the chart by clicking on the line and pressing the delete key.
Instant Connection to an Expert through our Excelchat Service
Most of the time, the problem you will need to solve will be more complex than a simple application of a formula or function. If you want to save hours of research and frustration, try our live Excelchat service! Our Excel Experts are available 24/7 to answer any Excel question you may have. We guarantee a connection within 30 seconds and a customized solution within 20 minutes.


Leave a Comment