

We can calculate cumulative sum by applying the cumulative formula to a cell, and then repeat the action for subsequent cells. We can use these values to plot a cumulative line graph or chart. This tutorial will teach us how to calculate cumulative sum and plot a cumulative graph.
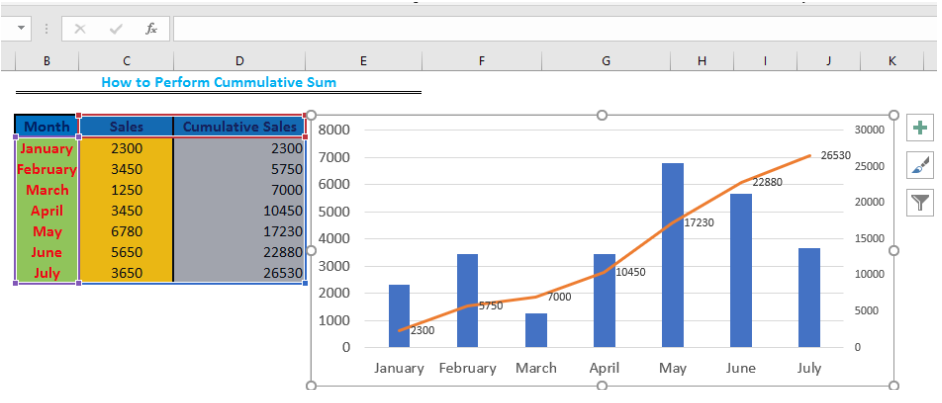 Figure 1: Cumulative Sum: Cumulative Chart
Data for Cumulative Sum in Excel
- We will tabulate our data according to the period or date of sales.
 Figure 2: Table of Data
We will calculate the cumulative sales by starting with Cell D4. The value of the cumulative sum of the first month would be the same as the first sale, since there has not being subsequent sales. A cumulative sale accumulates over an extended period of time.
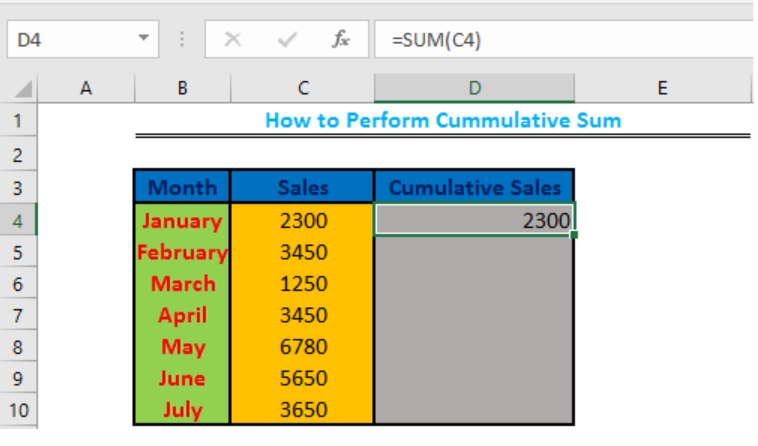 Figure 3: Cumulative sale for January
- We will now type this formula
=SUM(D4+C5)into Cell D5
 Figure 4a: Cumulative Sum of the Second month
We will click OK
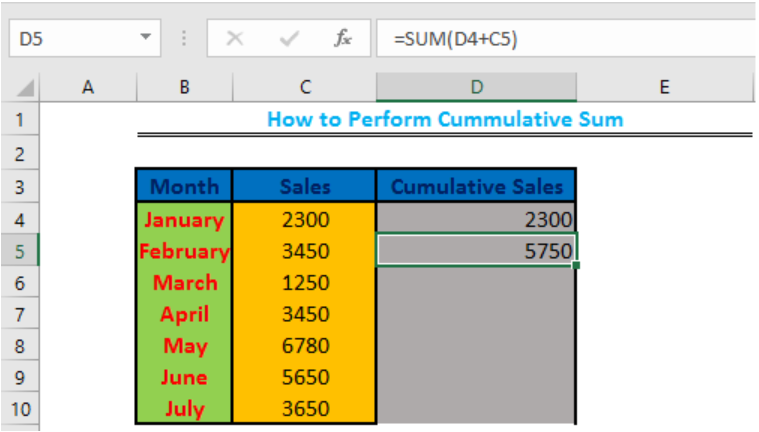 Figure 4b: Cumulative sum formula for February
- We will double-click on the fill handle (the small box at the bottom right of Cell D5 as shown in Figure 4b) and drag down to Cell D10 to calculate the cumulative sum for the remaining months (March – July)
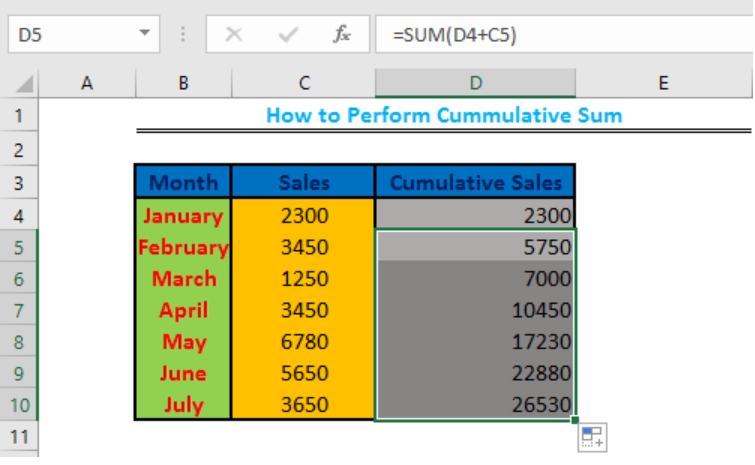 Figure 5: Cumulative sum of the remaining months
Cumulative chart
- We will highlight the data in the Month and Sales columns and prepare a chart with them by clicking the insert icon. We will click recommended chart from the chart group and select the first chart.
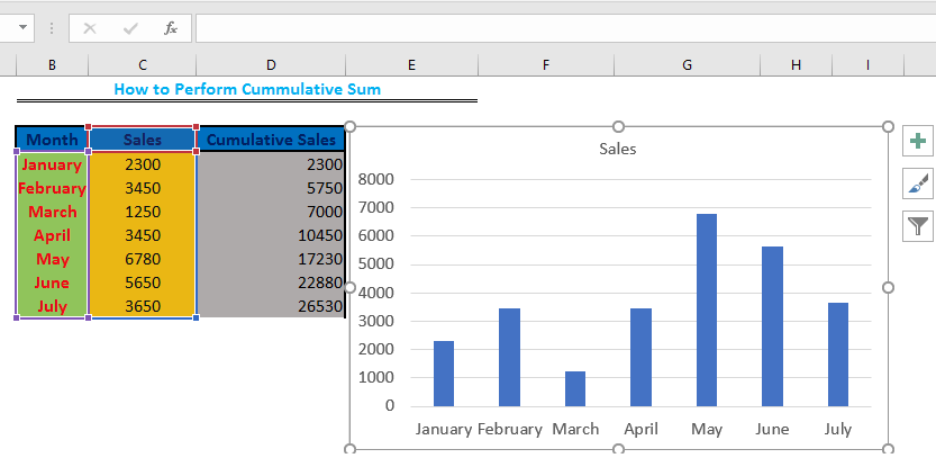 Figure 6: Cumulative Chart
- To add the cumulative sales, we will right-click on the chart and click on select data. We will now click on add to open the Edit Series dialog box. We will click on Series name and click on Cell D3 to input the Series name as “cumulative sales”. We will thereafter, click on Series values and highlight the data from Cells D4 to D10, then we will click on OK, and again, OK
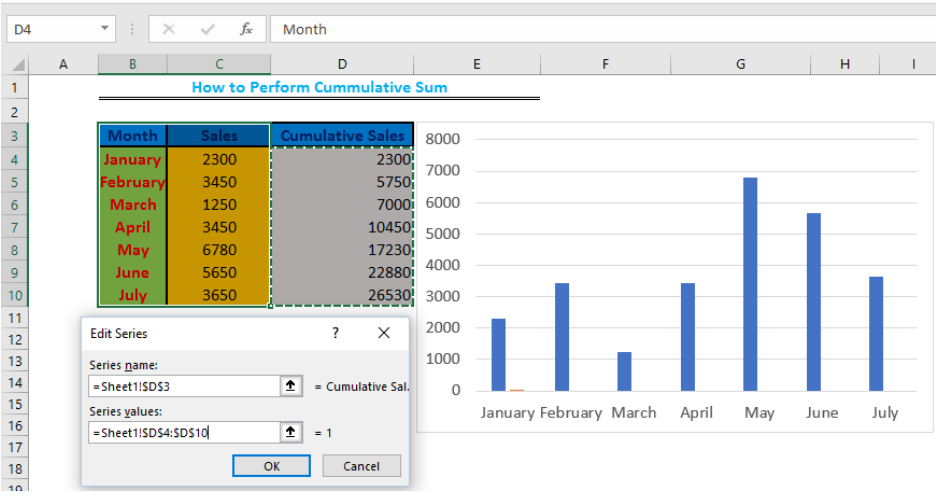 Figure 7a: Inputting the cumulative sales’ title and data
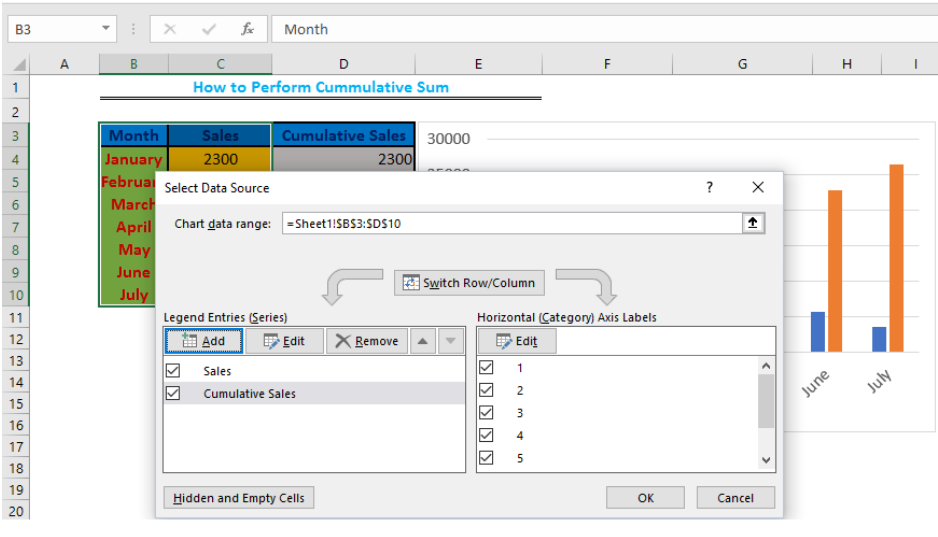 Figure 7b: Inputting the cumulative sales’ title and data
- We will right-click any of the cumulative sum bars and select format data series, then we will select secondary axis
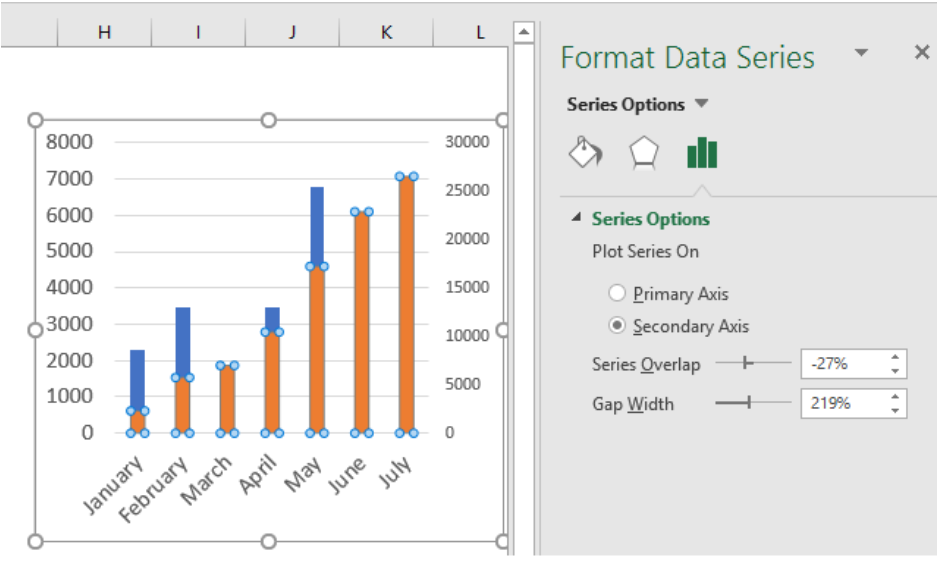 Figure 8: Changing to Secondary Axis
We will now change the chart type to line by clicking on design and select change chart type
 Figure 9a- Change chart type
- We will scroll to where the cumulative sales is displayed and click on the drop-down arrow to change it to line. Thereafter, we will click OK
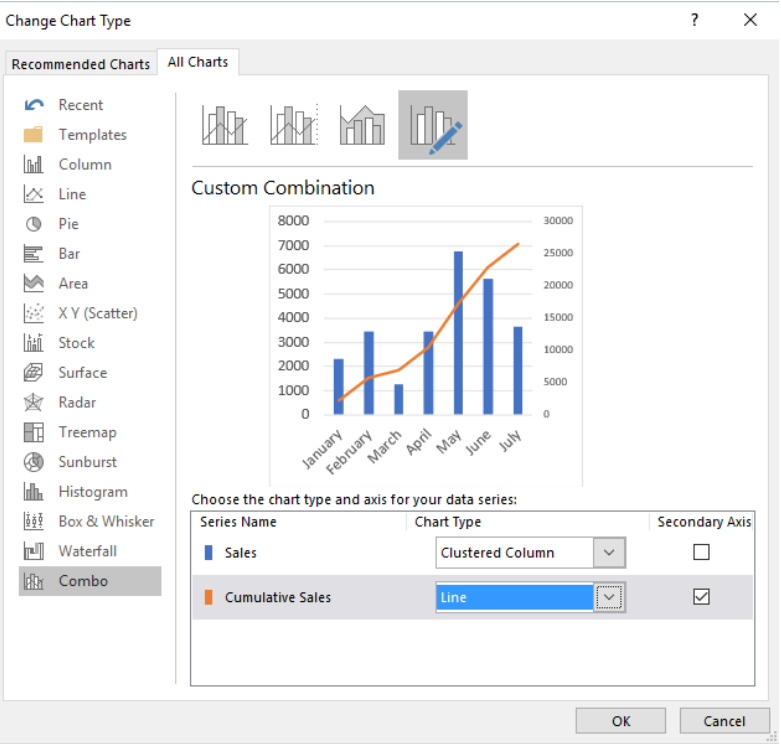 Figure 9b: Change Chart type to line
- We will now right-click on the line to add data label
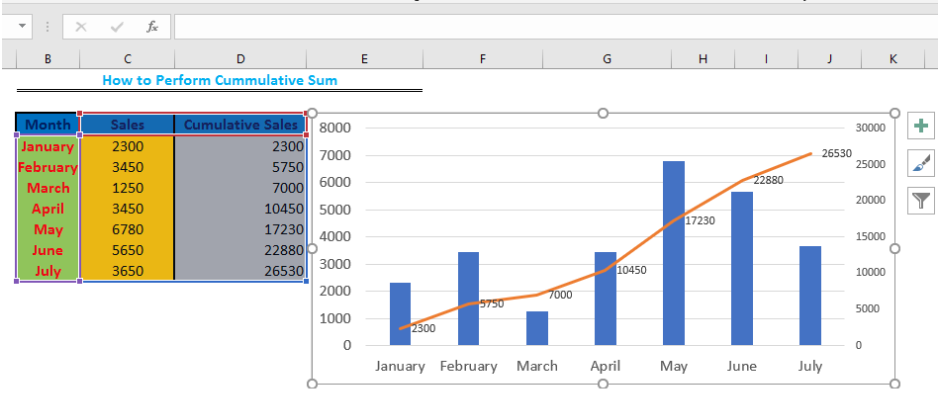 Figure 10: Cumulative line chart
Instant Connection to an Expert through our Excelchat Service
Most of the time, the problem you will need to solve will be more complex than a simple application of a formula or function. If you want to save hours of research and frustration, try our live Excelchat service! Our Excel Experts are available 24/7 to answer any Excel question you may have. We guarantee a connection within 30 seconds and a customized solution within 20 minutes.


Leave a Comment