

We can create a bell curve, also called the normal probability distribution curve to show probable events. The highest point of the bell curve is called the highest probability of occurrence, and the occurrence goes down to either side of the curve. We can use bell curves to evaluate exam grades or employee performance appraisals. In this tutorial, we will learn how to make a bell curve and save as a blank bell curve template.
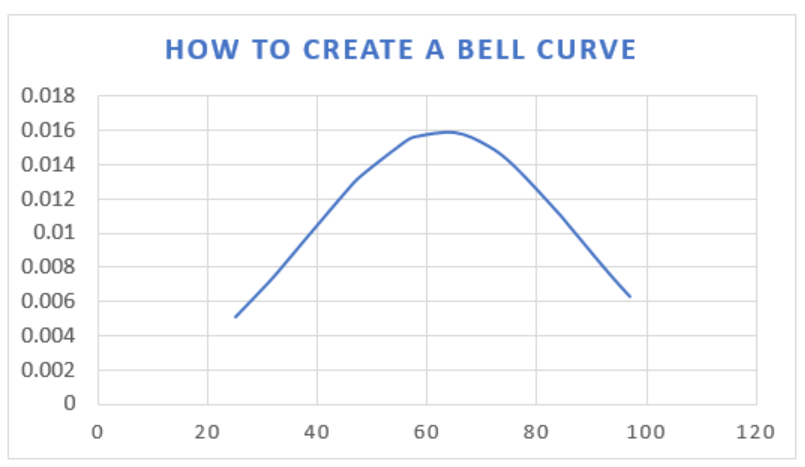 Figure 1 – How to make a bell curve
Creating a Bell Curve in Excel
- In a blank workbook, we will enter the following column headers, as shown in the figure below.
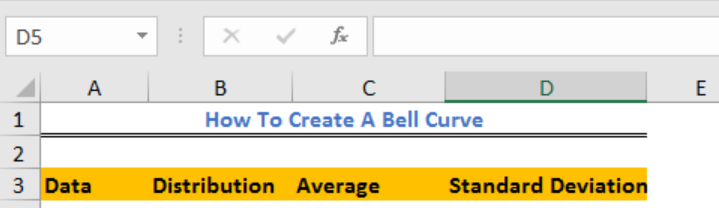 Figure 2 – Column headers for distribution table in Excel
- Next, in Column A, we will enter the data as shown in figure 3
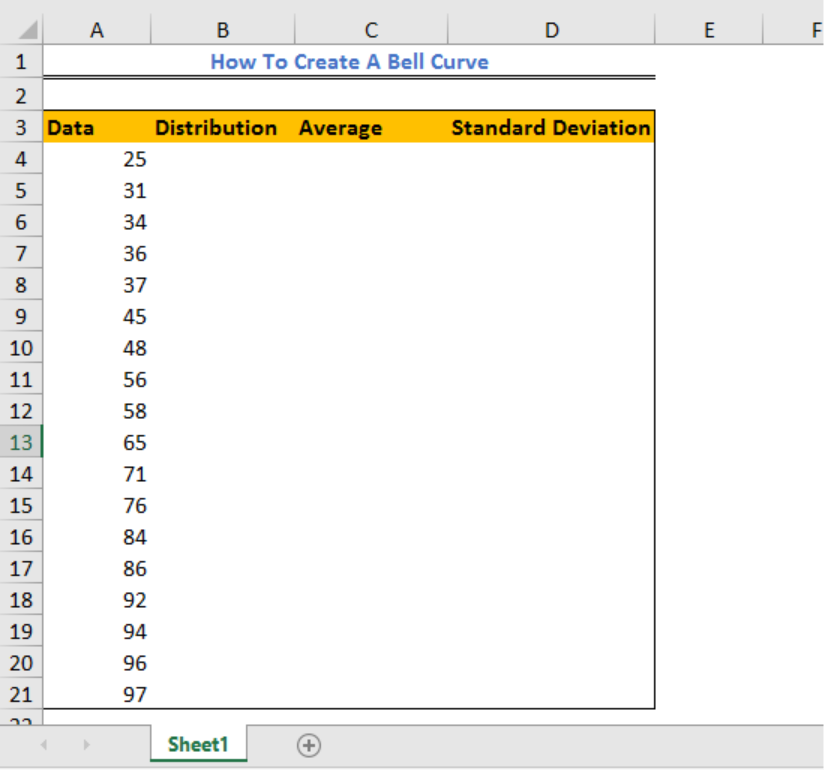 Figure 3 – Data for normal distribution function in Excel
- In Column C (Average), we will enter the formula below in Cell C4 and press the enter key
=AVERAGE(A4:A21)
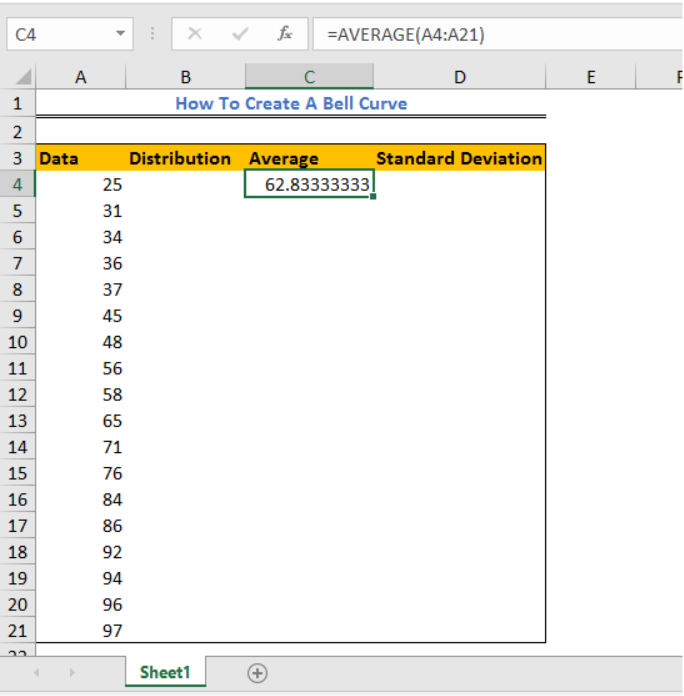 Figure 4 – Calculating Average for a bell curve
- In Column D (Standard Deviation), we will enter the formula below in Cell D4 and press the enter key.
=STDEV(A4:A21)
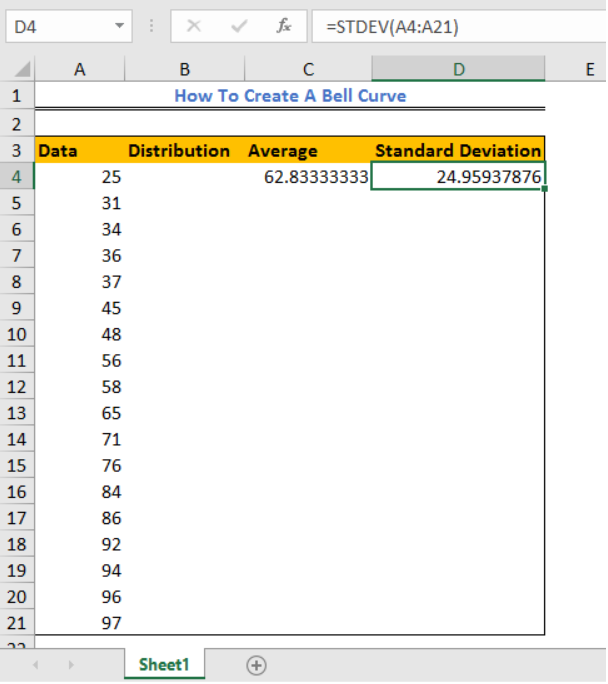 Figure 5 – Calculating Standard Deviation for creating a bell curve in Excel
- Now, we will go back to Cell B4, enter the formula below and press enter
=NORM.DIST(A4,$C$4,$D$4,FALSE)– Excel 2010, 2013 and 2016
=NORMDIST(A4,$C$4,$D$4,FALSE)– Excel 2007
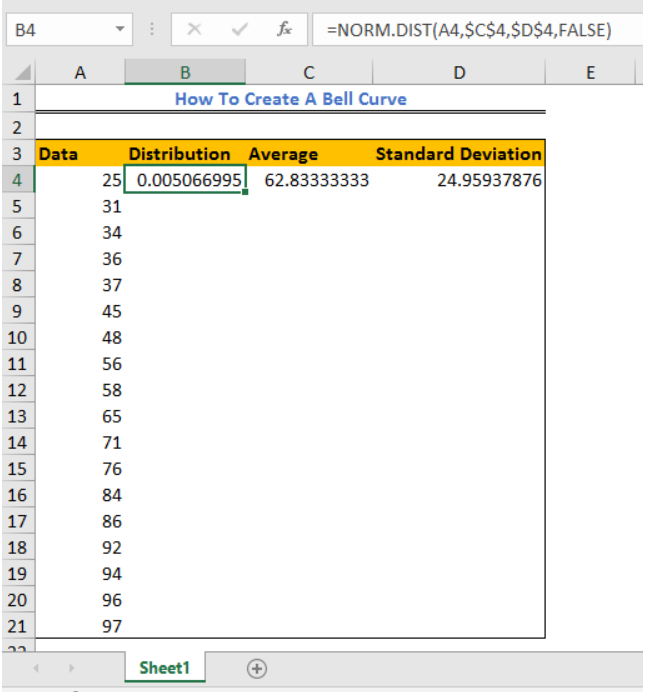 Figure 6 – Norm Distribution Function
- Now, we will drag the formula in Cell B2 down the column.
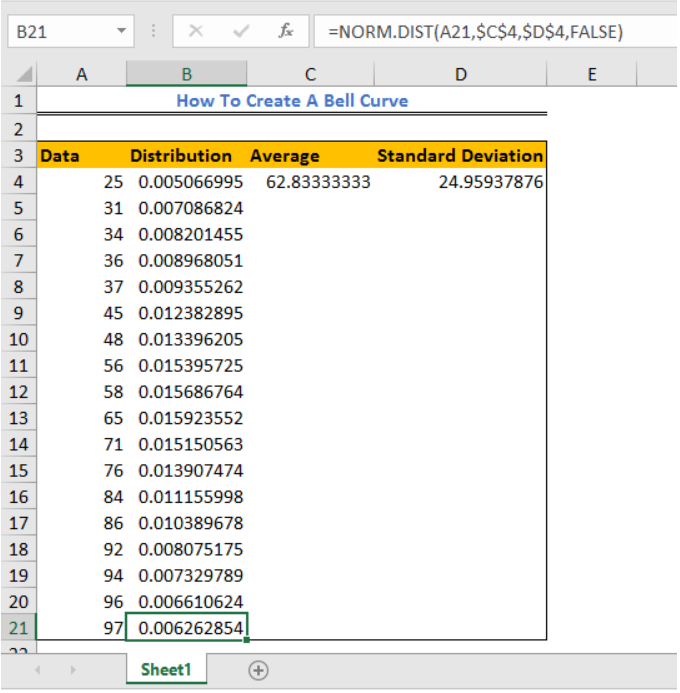 Figure 7 – Normal Distribution function
- We will highlight the range A4:B21(Data Column and Distribution Column)
- We will click on Insert and select Scatter (In Excel 2013, we will choose Scatter and Doughnut chart in Excel) and select Scatter with Smooth Lines and Markers
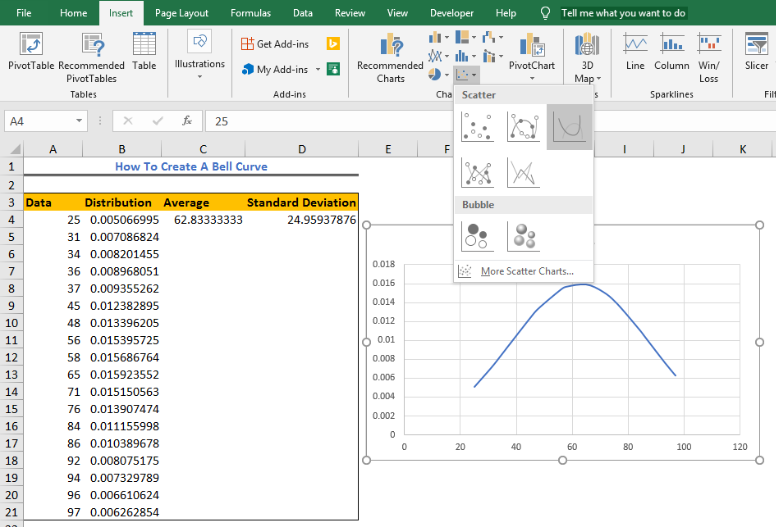 Figure 8 – Bell Curve on Excel
- Our Bell curve chart will look like this
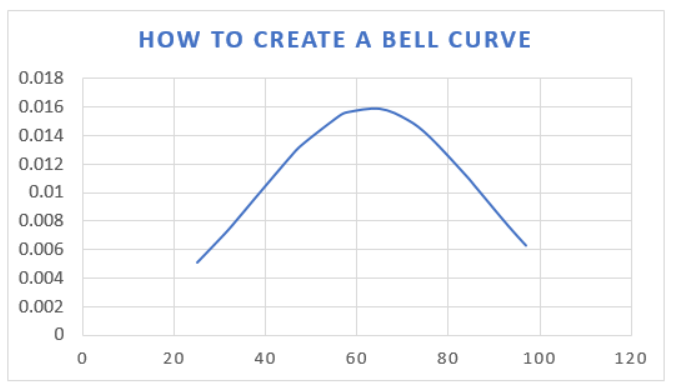 Figure 9 – Creating a bell curve in Excel
Making a Blank Bell Curve Template
We call also save Bell Curve chart as a normal chart template so we can use it for future calculations by following these steps:
1. To save;
- In Excel 2013 or 2016, we will right click on the Bell curve chart, and select Save as Template.
2. In Excel 2010 and 2007, we will click on the Bell curve chart to activate the Chart Tools. Next, we will go to Design and click on Save As Template
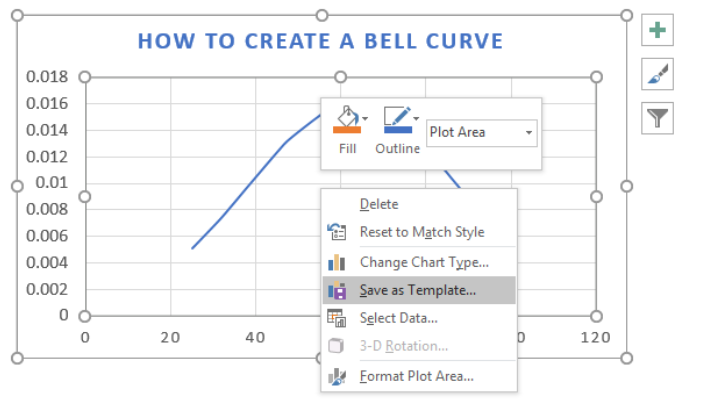 Figure 10 – Creating a Bell curve template
3. In the Save Chart Template Dialog box, we will enter the name we wish for our template in the File name box and select the Save Button.
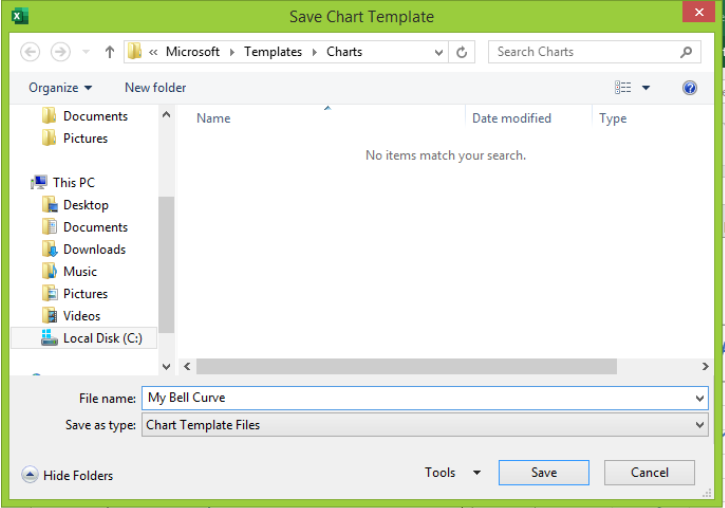 Figure 11 – Creating a blank bell curve template
Instant Connection to an Excel Expert
Most of the time, the problem you will need to solve will be more complex than a simple application of a formula or function. If you want to save hours of research and frustration, try our live Excelchat service! Our Excel Experts are available 24/7 to answer any Excel question you may have. We guarantee a connection within 30 seconds and a customized solution within 20 minutes.


Leave a Comment