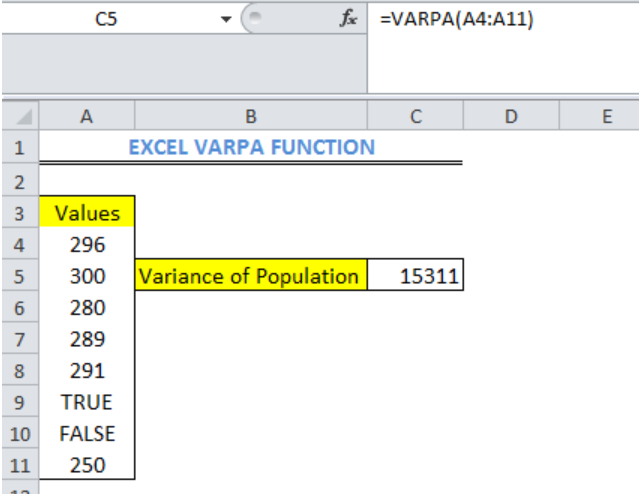
We can use the statistical Excel VARPA function to calculate the variance of a population. This calculation can include text and logical values. Logical values like TRUE, FALSE and TEXT has the values of 1, 0 and 0 respectively. This article will step through the use of the VARPA function.
 Figure 1: Variance of Population with the Excel VARPA Function
The syntax for Excel VARPA function
=VARPA(Value1, [Value2, ... Value_n])
Formula
=VARPA(A4:A11)
Setting up the Data
We will set up the data according to the content of figure 2.
- The values whose variance we intend to calculate are in Column A.
- The output or result of the variance of a population will be in Cell C5
 Figure 2: How to Use the Excel VARPA Function
Using the VARPA Function
- We will click on Cell C5 and insert the formula:
=VARPA(A4:A11)
- We will press the enter key
 Figure 3: Variance of Population with the Excel VARPA Function
Note
- The EXCEL VARPA Function is used for arguments that represent only an entire population. For values that represent a sample of a population, the Excel VARA function is used.
- We can ignore logical and text values in references with the Excel VARP or VAR.P function to calculate variance based on an entire population.
- Empty cells in arrays or cell references are ignored in EXCEL VARPA Function
Instant Connection to an Expert through our Excelchat Service
Most of the time, the problem you will need to solve will be more complex than a simple application of a formula or function. If you want to save hours of research and frustration, try our live Excelchat service! Our Excel Experts are available 24/7 to answer any Excel question you may have. We guarantee a connection within 30 seconds and a customized solution within 20 minutes.


Leave a Comment