

Excel enables us to calculate the standard deviation of any data set in no time by using one of these functions: STDEV, STDEVP, STDEV.S, STDEVA. STDEV.P, STDEVPA.
Now that’s just confusing.
But with the following checklist, we will be able to determine the appropriate function to use:
- What Excel version are we using? Are we still using version 2007 and earlier?
- Do the arguments represent just a sample of the population or the entire population?
- Do we ignore the text and logical values, or evaluate them?
- Note: Text and the logical “FALSE” are evaluated as “0” while “TRUE” is evaluated as “1”
We answer those three questions and refer to the table below:
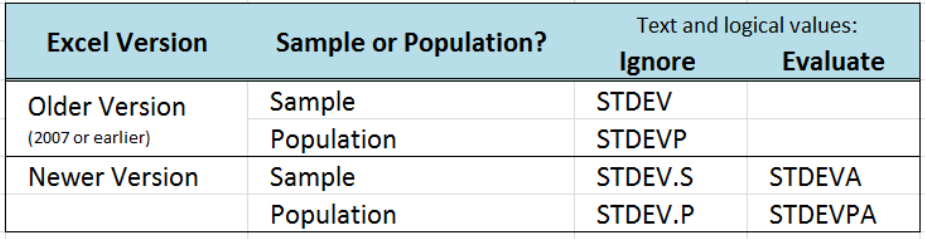 Figure 1. Table guide for which standard deviation function to use
This table will help us understand the different uses and relevance of the standard deviation functions. It guides us through which function to use in Excel for standard deviation if we consider the entire population or just a sample size.
Sample problem 1
Which function in Excel do we use to calculate the standard deviation of a sampled data set?
To calculate standard deviation in Excel with a sampled data set, we can use the STDEV, STDEV.S or STDEVA functions. In order to determine which function to use, let us walk through the checklist:
- What Excel version are we using? Are we still using version 2007 and earlier?
Newer than 2007
- Do the arguments represent just a sample of the population or the entire population?
Sample
- Do we ignore the text and logical values, or evaluate them?
Ignore
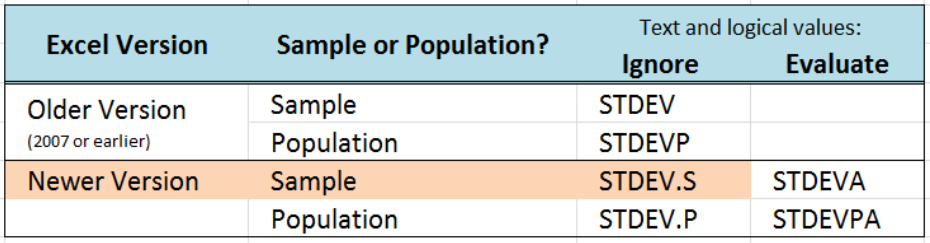 Figure 2. Table guide showing STDEV.S as the best function to use
Referring to our checklist and table, if we are using a newer version of Excel and we want to ignore the text and logical values, the function to use is STDEV.S.
Sample problem 2
Excel standard deviation p versus s
As discussed above, the checklist and the table will guide us in deciding whether to use the Excel STDEV.P or STDEV.S when we calculate for standard deviation. It is critical to use the correct function in order to obtain accurate results.
Example
There are 10 students in a class and their scores in a test are given in the table below. Compute for the standard deviation.
Solution
Since there are only 10 students in the class, the 10 scores represent the entire population of data. Using the newer version of Excel and ignoring text and logical values, the table shows that we must use STDEV.P to calculate the standard deviation.
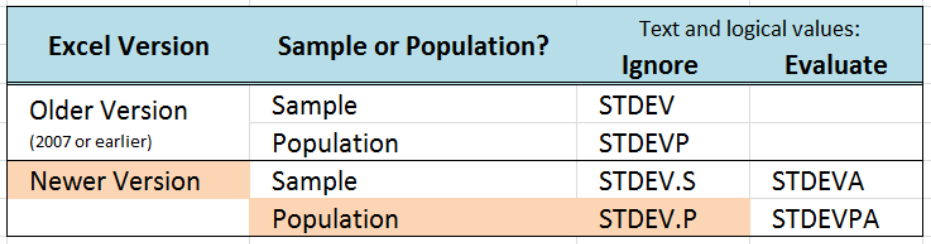 Figure 3. Table guide showing STDEV.P as the best function to use
Syntax of STDEV.P
=STDEV.P(number1,[number2],...])
- number1 – any value, cell reference or range corresponding to a population, for which we want to compute for standard deviation
- only number1 is required, succeeding numbers are optional
We enter the following formula in cell D3:
=STDEV.P(B3:B12)
As a result, the standard deviation of the scores is 6.4195.
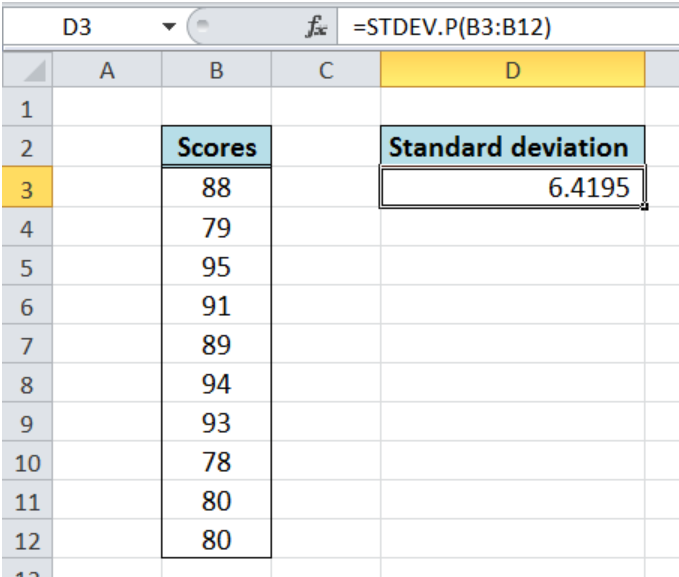 Figure 4. Entering STDEV.P formula to calculate standard deviation
Suppose we have used the function STDEV.S instead. The result would have been different as shown below:
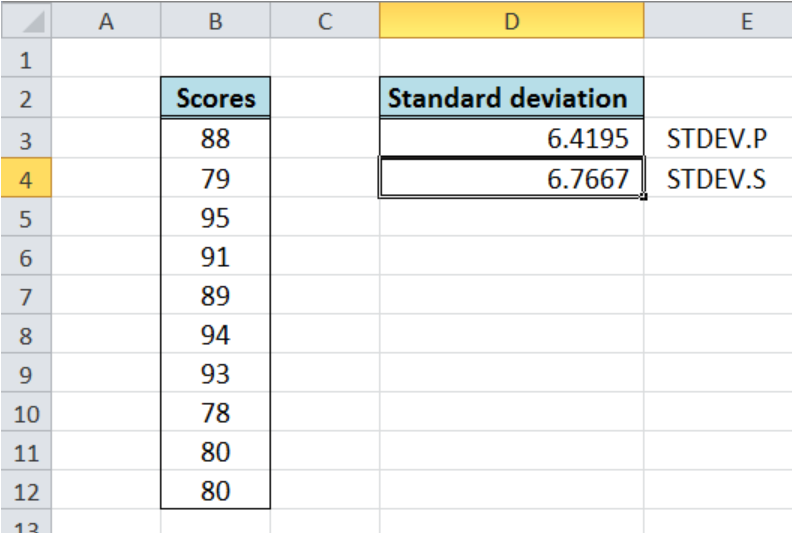 Figure 5. Output: Excel standard deviation p versus s
Using the wrong function will lead to erroneous results.
Sample problem 3
How to calculate Excel standard deviation with IF?
While working with Excel, we can categorize our data and calculate the standard deviation by incorporating the IF function.
Suppose we have a table showing ten scores of students with different levels. We want to find the standard deviation per level. We follow these steps:
- Enter this formula in cell F3:
=STDEV.S(IF($B$3:$B$12=E3,$C$3:$C$12)) - Copy the formula in cell F3 to cells F4:F5 by clicking the “+” icon at the bottom-right corner of cell F3 and dragging it down
- For each cell in F3:F5, we have to select the cell and press Ctrl + Shift + Enter to activate the array formula
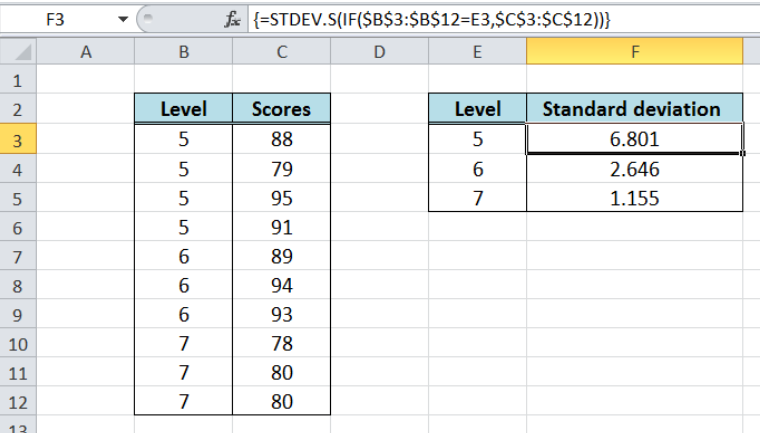 Figure 6. Output: Excel standard deviation with IF
As a result, the standard deviation per level is calculated by using the STDEV.S function.
Most of the time, the problem you will need to solve will be more complex than a simple application of a formula or function. If you want to save hours of research and frustration, try our live Excelchat service! Our Excel Experts are available 24/7 to answer any Excel question you may have. We guarantee a connection within 30 seconds and a customized solution within 20 minutes.


Leave a Comment