

R squared is an indicator of how well our data fits the model of regression. Also referred to as R-squared, R2, R^2, R2, it is the square of the correlation coefficient r.
The correlation coefficient is given by the formula:
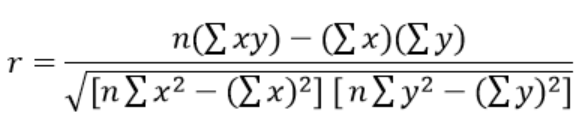 Figure 1. Correlation coefficient formula
R squared formula
Hence, the formula for R squared is given by
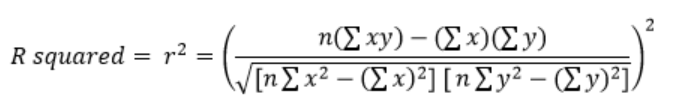 Figure 2. R squared formula in regression
In the formula, x and y are two variables for which we want to determine for any linear or non-linear correlation. The value of R squared shall indicate that if there is correlation between the two variables, a change in value of the independent variable will likely result to a change in the dependent variable.
What is R squared
The formula for R squared is quite complicated, and entering the values in a cell is prone to errors in calculation. Fortunately, Excel has built-in functions that allow us to easily calculate the R squared value in regression.
The correlation coefficient, r can be calculated by using the function CORREL. R squared can then be calculated by squaring r, or by simply using the function RSQ. In order to calculate R squared, we need to have two data sets corresponding to two variables.
Data for R squared
Suppose we have below values for x and y and we want to add the R squared value in regression.
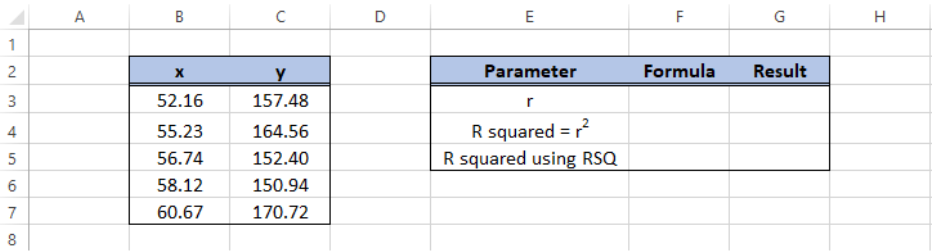 Figure 3. Sample data for R squared value
How to find the R2 value
There are two methods to find the R squared value:
- Calculate for r using CORREL, then square the value
- Calculate for R squared using RSQ
Enter the following formulas into our worksheets:
- In cell G3, enter the formula
=CORREL(B3:B7,C3:C7) - In cell G4, enter the formula
=G3^2 - In cell G5, enter the formula
=RSQ(C3:C7,B3:B7)
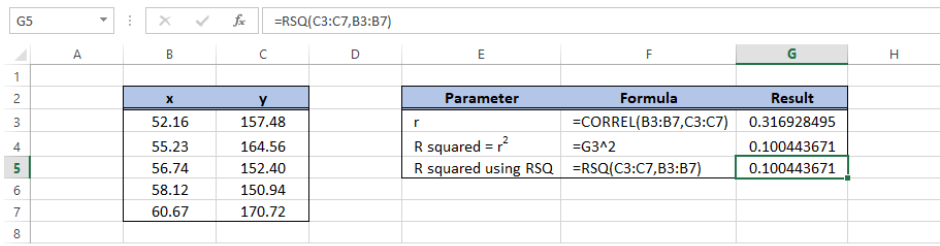 Figure 4. Output: How to find R squared value
The results in G4 and G5 show that both methods have the same result for R squared which is 0.100443671. With Excel, adding the R squared value is very easy with the help of the functions CORREL and RSQ.
R squared is relevant in various fields such as in stock market and mutual funds because it is able to find the probability or present the correlation between two variables, and it has the ability to explain how much of the movement of one variable can explain the trend of another variable.
Instant Connection to an Excel Expert
Most of the time, the problem you will need to solve will be more complex than a simple application of a formula or function. If you want to save hours of research and frustration, try our live Excelchat service! Our Excel Experts are available 24/7 to answer any Excel question you may have. We guarantee a connection within 30 seconds and a customized solution within 20 minutes.


Leave a Comment