
We can use VBA to create a pivot table in less time by applying macro codes. In this guide, we will learn how to automate our pivot table using VBA.
 Figure 1- How to create a Pivot table with VBA
Convert data to a table
- We will convert our data to a table by clicking Insert, and then, Table
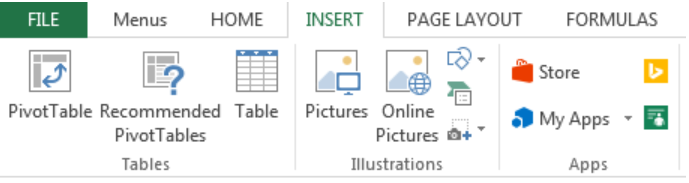 Figure 2- Click on Table
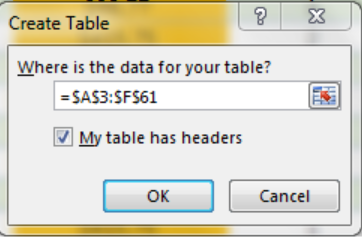 Figure 3- Create Table dialog box
- We will click OK
- Next, we will name our table as SalesPivotTable in the name box below file as shown below
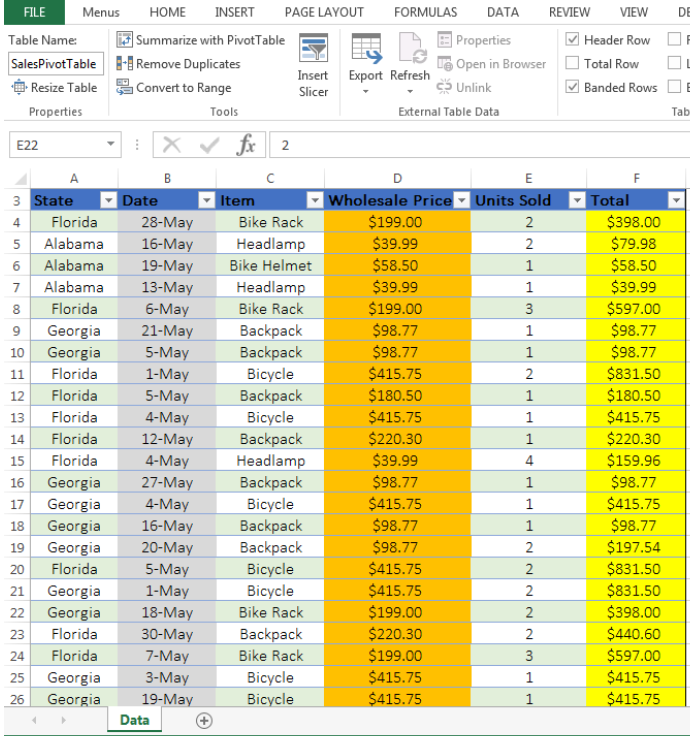 Figure 4- Data Table
- We will rename our sheet as “Data”
Steps to Write the VBA Code
Declare Variables
We need to declare the variables in the code to define different aspects:
- PSheet: This implies that we want to create a sheet for a new pivot table
- DSheet: To apply a datasheet
- PChache: Apply as a name for pivot table cache
- PTable: Apply a name for our pivot table
- PRange: This defines the source data range (the range of our table, A3:F61)
- LastRow and LastCol: We use this to acquire the last row and column of our data range.
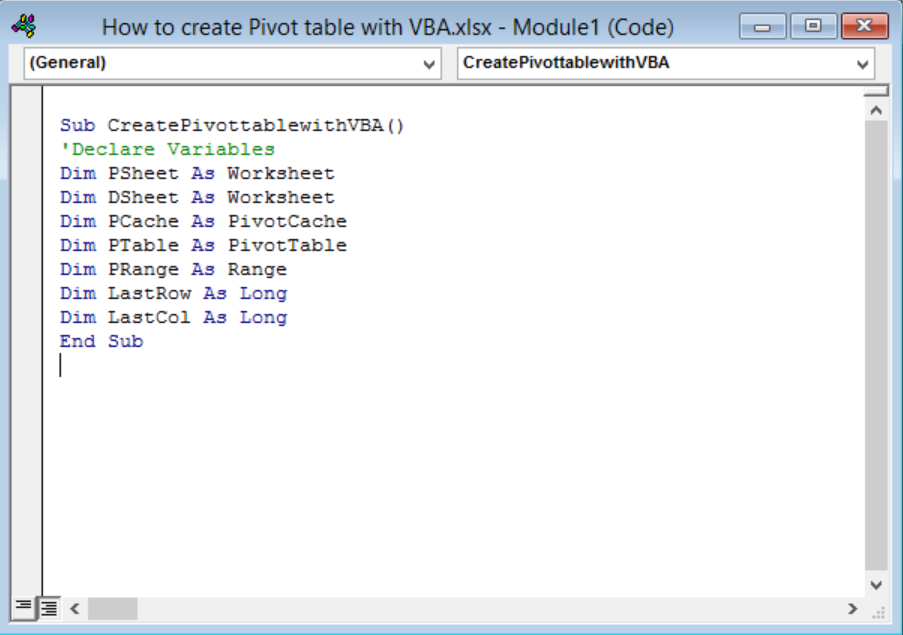 Figure 5 – Declare all variables
Insert a New Worksheet
We will create a code for excel to place our Pivot Table in a blank sheet. With this code, we will insert a new worksheet titled “Pivot table.” Our values will be set as PSheet Variable to Pivot table Worksheet and DSheet to source data Worksheet. Whenever we want to change the name of the worksheet, we can do so from the code. We must note that if there is a worksheet named PivotTable, the code will delete it before creating the Pivot Table with VBA Code.
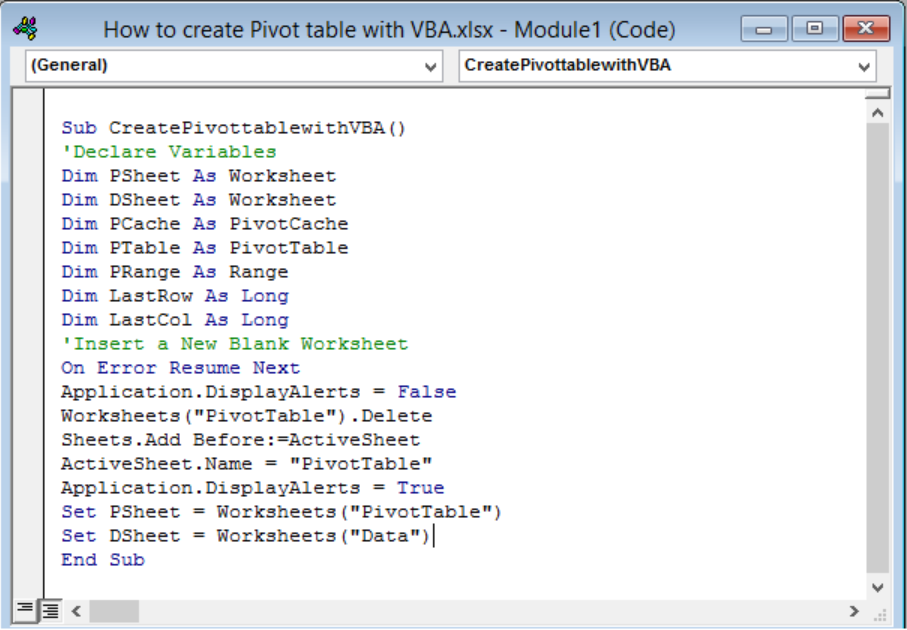 Figure 6 – Insert a New Worksheet
Defining Data Range
We will specify the range of the data from our source worksheet. This code will identify an entire data and not a fixed source range. The code will start from the first cell of the first row. It moves down to the last row, and then, to the last column. It will update itself, not minding how large or small our source data is.
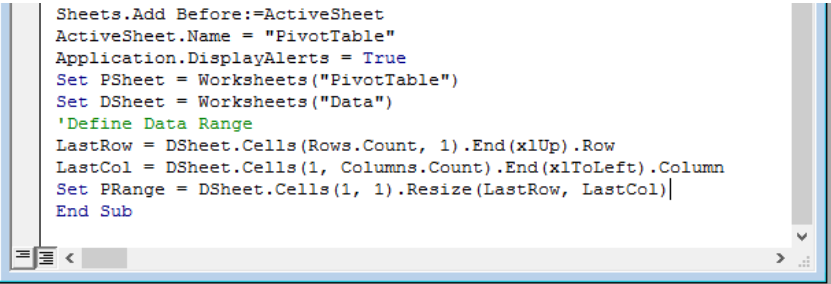 Figure 7 – Define data range
Create Pivot Cache
Excel automatically creates a Pivot table Cache for us without asking. With VBA, we have to write the code for this by first defining a pivot cache through the data source. Also, we will define the cell address of the current inserted worksheet to create the pivot table.
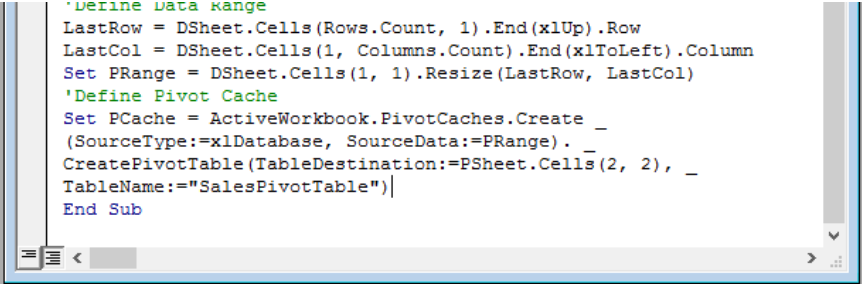 Figure 8 – Create Pivot Cache
Create a Blank Pivot Table
This code will enable us to have a Blank Pivot Table before we select the fields that we want. We can alter it within the code at any time.
![]() Figure 9 – Create a Blank Pivot Table
Figure 9 – Create a Blank Pivot Table
Insert Rows and Columns
Because we normally insert rows and columns, in the same manner, we will write code to do so. We will add years and month (Date) to the rows field and Zone to the column field. We will ensure that there is a position number to identify the sequence of fields, especially when we want to add more than one array to the same field.
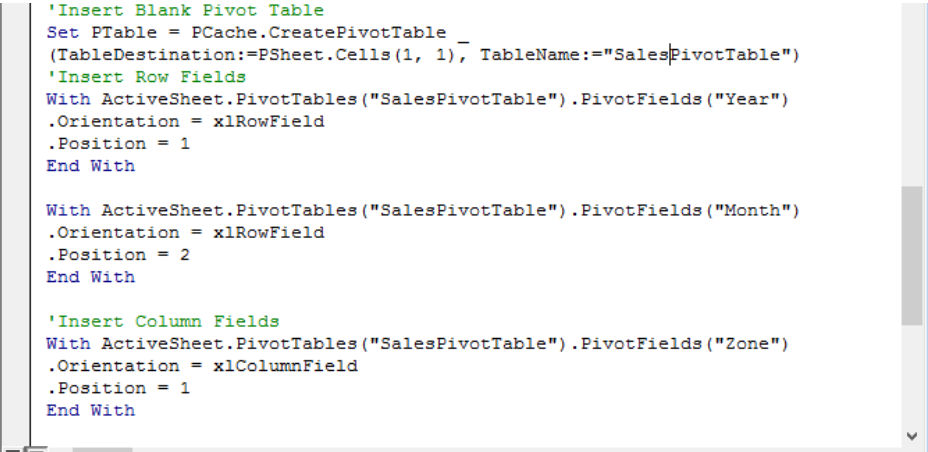 Figure 10 – Insert Rows and Columns
Insert Data Field
We will define the value field for our pivot table. For example, we may use the xlsum to depict the sum values. We will use the (,) separator to identify values as a number.
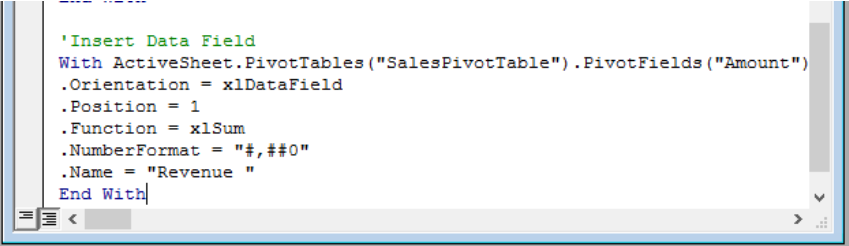 Figure 11 – Insert Values Data Field
Format Pivot table
Lastly, we will also need a code to format our pivot table especially when we wish to change the formatting style of the Pivot table within the code. For our example, we will apply rows strips and “Pivot Style Medium 9”.
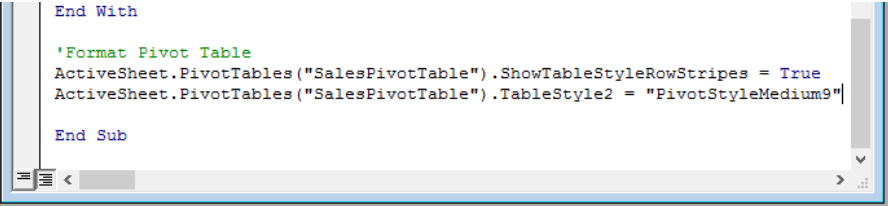 Figure 12 – Format Pivot Table
Run the Macro code to Create a Pivot table
Now, we have finished creating the VBA Code, we can run our code to create a pivot table.
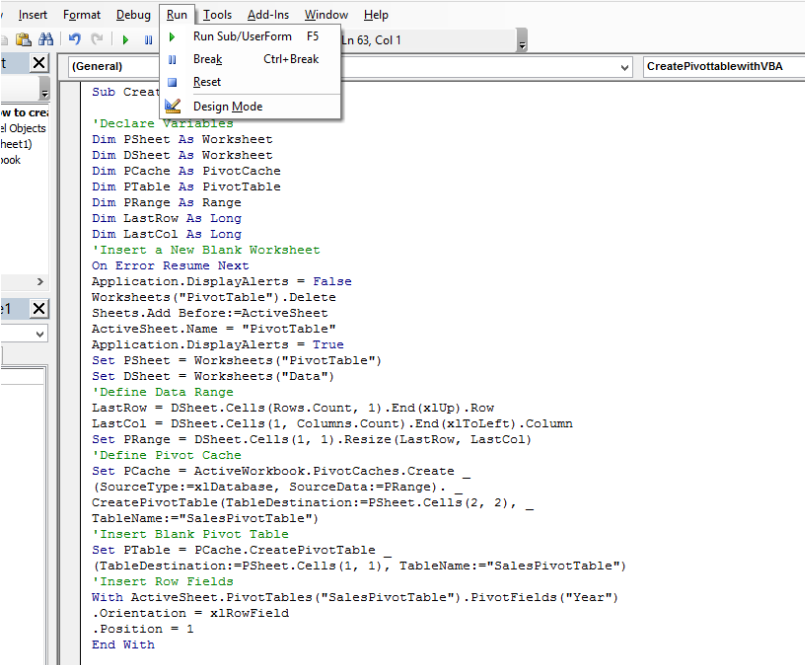 Figure 13 – Run the Macro code
- When we click on RUN, we will be instantly presented with the Pivot Table field, here, we will select “More Tables”, then Yes
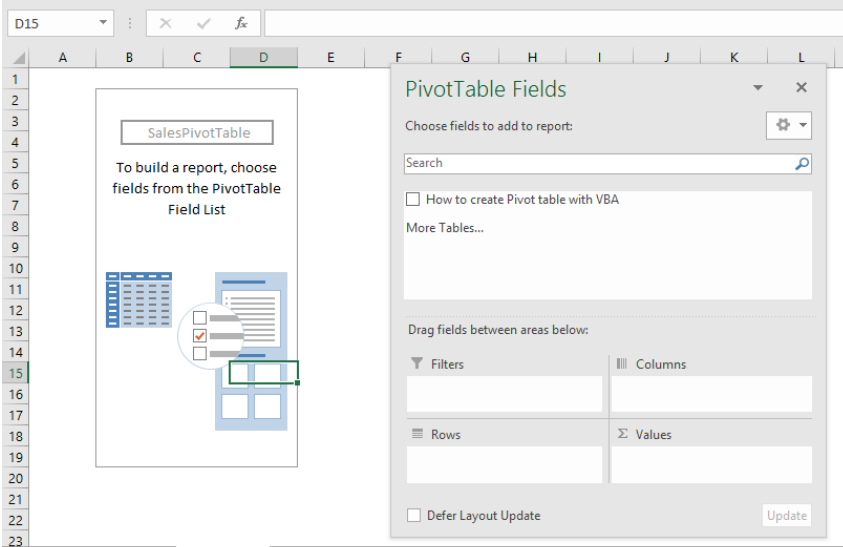 Figure 14 – Select Worksheet
- Lastly, we will select “SalesPivotTable” and press OK
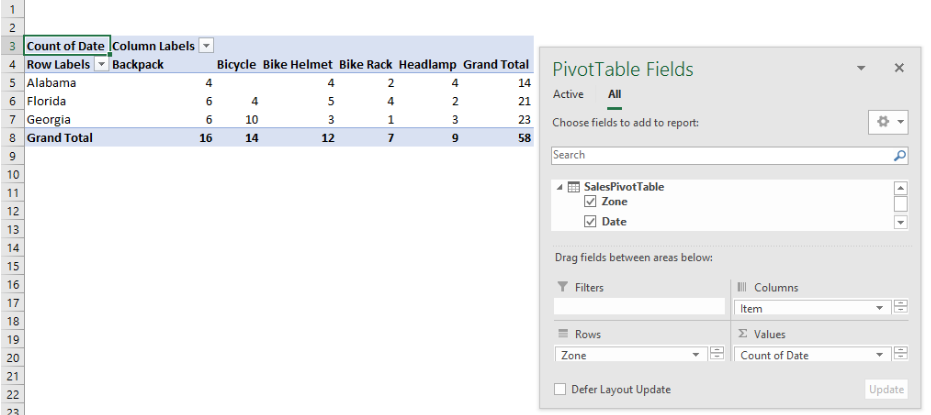 Figure 15 – Finished Pivot Table with Macro Code
Full Pivot Table Macro Code
Sub CreatePivottablewithVBA()
'Declare Variables
Dim PSheet As Worksheet
Dim DSheet As Worksheet
Dim PCache As PivotCache
Dim PTable As PivotTable
Dim PRange As Range
Dim LastRow As Long
Dim LastCol As Long
'Insert a New Blank Worksheet
On Error Resume Next
Application.DisplayAlerts = False
Worksheets("PivotTable").Delete
Sheets.Add Before:=ActiveSheet
ActiveSheet.Name = "PivotTable"
Application.DisplayAlerts = True
Set PSheet = Worksheets("PivotTable")
Set DSheet = Worksheets("Data")
'Define Data Range
LastRow = DSheet.Cells(Rows.Count, 1).End(xlUp).Row
LastCol = DSheet.Cells(1, Columns.Count).End(xlToLeft).Column
Set PRange = DSheet.Cells(1, 1).Resize(LastRow, LastCol)
'Define Pivot Cache
Set PCache = ActiveWorkbook.PivotCaches.Create _
(SourceType:=xlDatabase, SourceData:=PRange). _
CreatePivotTable(TableDestination:=PSheet.Cells(2, 2), _
TableName:="SalesPivotTable")
'Insert Blank Pivot Table
Set PTable = PCache.CreatePivotTable _
(TableDestination:=PSheet.Cells(1, 1), TableName:="SalesPivotTable")
'Insert Row Fields
With ActiveSheet.PivotTables("SalesPivotTable").PivotFields("Year")
.Orientation = xlRowField
.Position = 1
End With
With ActiveSheet.PivotTables("SalesPivotTable").PivotFields("Month")
.Orientation = xlRowField
.Position = 2
End With
'Insert Column Fields
With ActiveSheet.PivotTables("SalesPivotTable").PivotFields("Zone")
.Orientation = xlColumnField
.Position = 1
End With
'Insert Data Field
With ActiveSheet.PivotTables("SalesPivotTable").PivotFields("Amount")
.Orientation = xlDataField
.Position = 1
.Function = xlSum
.NumberFormat = "#,##0"
.Name = "Revenue "
End With
'Format Pivot Table
ActiveSheet.PivotTables("SalesPivotTable").ShowTableStyleRowStripes = True
ActiveSheet.PivotTables("SalesPivotTable").TableStyle2 = "PivotStyleMedium9"
End Sub
Instant Connection to an Expert through our Excelchat Service
Most of the time, the problem you will need to solve will be more complex than a simple application of a formula or function. If you want to save hours of research and frustration, try our live Excelchat service! Our Excel Experts are available 24/7 to answer any Excel question you may have. We guarantee a connection within 30 seconds and a customized solution within 20 minutes.


Leave a Comment