

A pivot table in Excel is an excellent tool to analyze data. It helps you to aggregate, summarize, finding insights and present a large amount of data in just a few clicks. It is very flexible and can be changed without much effort.
You can create and modify pivot tables very quickly. It makes worksheets very manageable by summarizing them. Pivot tables can be expressed in various ways to make them more presentable. The data, represented in different ways can express new information. In this tutorial, we will look at transposing pivot table data in Excel.
Transposing Pivot Table Data
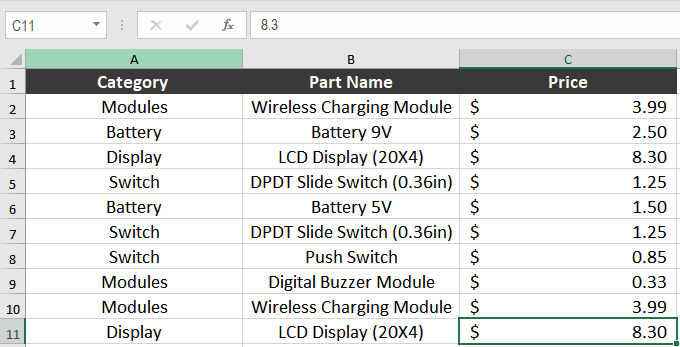
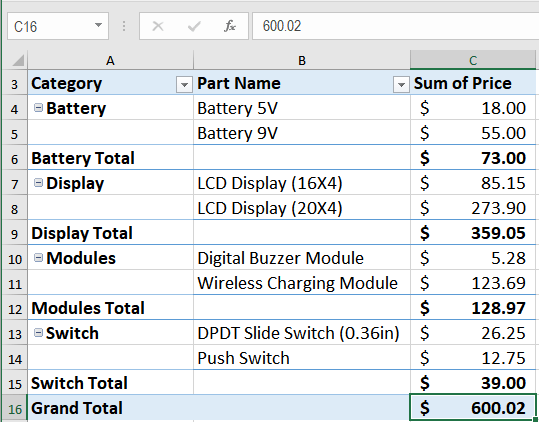
The following example has the data you will use in this tutorial. It contains the price list for electronics parts that are divided into four categories.
To create a pivot table from this data, you need to make a selection anywhere in the data. Now click Insert > Pivot table
See if the range is correct and the New Worksheet box is checked.
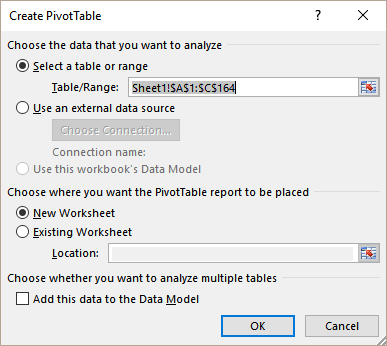
Click OK.
Now the new sheet will have the pivot table builder. To create the pivot table, you need to add the Category and Part Name as rows and Price as values. This will create the pivot table.
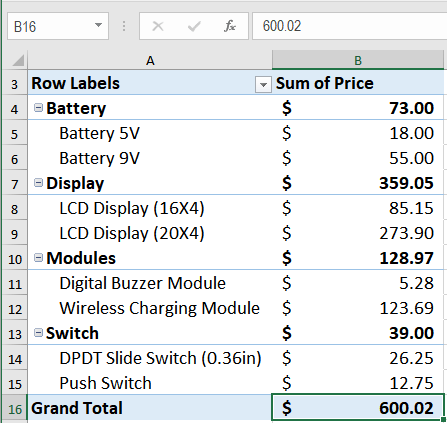
By default, Excel presents the pivot table in a compact layout. But this may not always be the best representation for your data. To transpose your pivot table data, we will have a look at the following examples.
Transposing Pivot Table Data from the Pivot Builder Option
Pivot tables have some great functionalities for pivoting and un-pivoting data. Although this is a concept in SQL operations, we can apply the same analogy to transpose data in pivot tables in Excel. We can do this using the pivot builder tool. Pivot builder is a tool that allows us to build pivot tables very easily with simple mouse clicks.
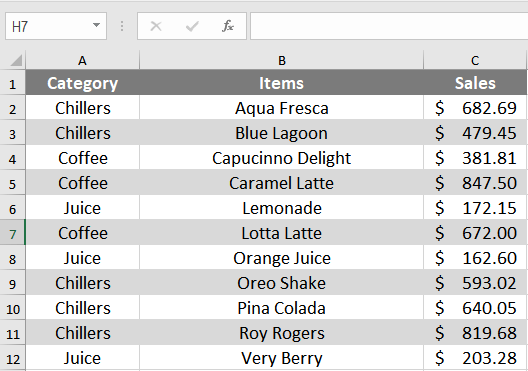
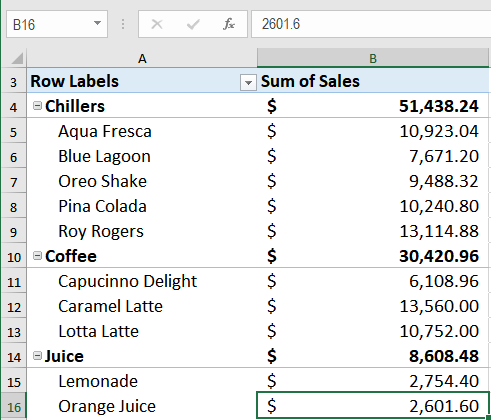
In the following Example, we have the sales for three categories of beverages: Juice, Chillers and Coffee and the yearly sales for each item.
To build the pivot table you will:
- Go to Insert Recommended PivotTables and select the second option Sum of Sales by Items.
![]()
- Click OK.
- Now to add the items in the pivot table, check the items option in the PivotTable fields area on the right.

You will have the pivot table grouped by categories. It is in a compact layout where both the category and Items are added as rows.
To present the data in a new dimension, you will now transpose it. To do so, you will make changes to the pivot builder section on the right in Excel.
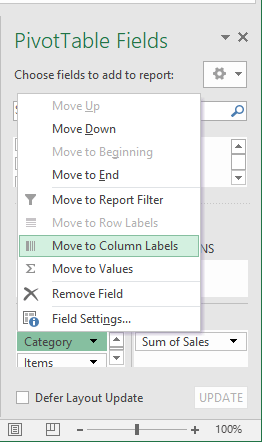
- At first, click the Category entry under rows in the pivot table builder. It will open some options. From there select Move to Column labels. This will move categories as column labels.
- In the next part click on Items under rows in the pivot builder option.
- Select Move to Column labels.
Now the pivot has transposed. The rows have switched to columns and the columns as rows. This allows us to view the data in a completely new way.

Transposing by Changing Layout to Show Tabular Form
You can transpose your data by changing the layout. The tabular format puts row labels next to each other. To set the pivot table layout to tabular format:
- Click anywhere in your pivot table, and the PivotTable options Analyze and Design will appear under the PivotTable Tools tab in the ribbon.
- Click on Design > Report Layout > Show in Tabular form.
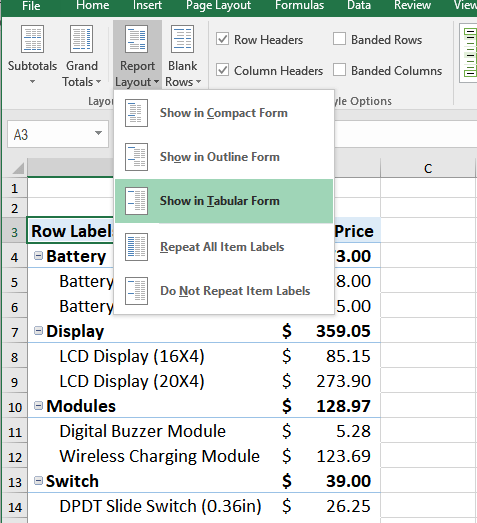
This will transpose our data in a tabular format and make our pivot table more presentable.
Pivot tables are a great way to summarize and aggregate data to model and present it. They have brought some revolutionary changes to how data is processed. You can now visualize and report data in the blink of an eye. Dashboards and other features have made gaining insights very simple using pivot tables.
It allows us to transpose data with just a few clicks that you saw in the previous examples. Both the pivot builder option and the tabular layout allows us to transpose data very easily. This paves the way to gain insights in a new way and turn data into knowledge.
There are many interesting features of Pivot Table and Power Pivot that could help you gain insights into your data. If you want to save hours of researching and frustration and get to the solution quickly, try our Excel Live Chat service! Our Excel experts are available 24/7 to answer any Excel question you have on the spot. The first question is free.


Leave a Comment