

We can quickly create a graph in Microsoft word regardless of the kind of operating system we have. In this tutorial, we will study how to create charts from tables in Word, create chart directly on Microsoft word and transfer graph from an Excel Sheet to Microsoft Word.
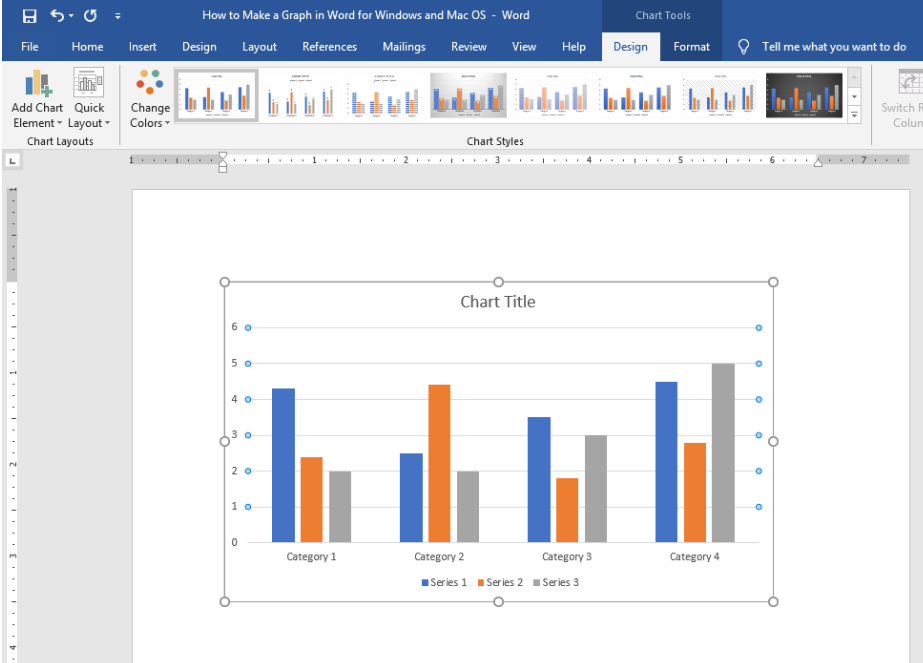 Figure 1 – How to create a graph in word
Making a Chart in Microsoft Word for Windows and Mac
Creating the Microsoft Word graph or chart follows the same process for both Windows and Mac. To create a graph, we will follow these steps:
- We will open the Word Document where we want to create our graph
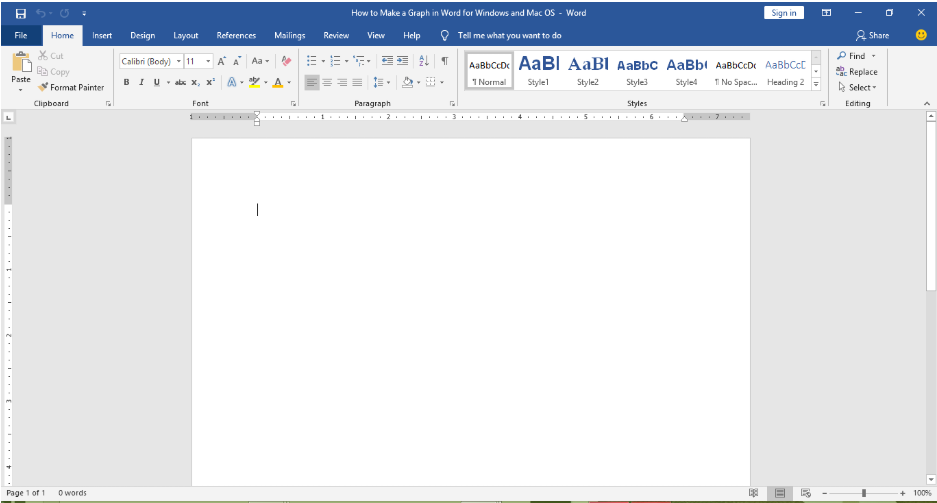 Figure 2 – Open Blank document for creating graph in Word
- We will click Insert Tab, navigate to the Illustrations group and select Chart button
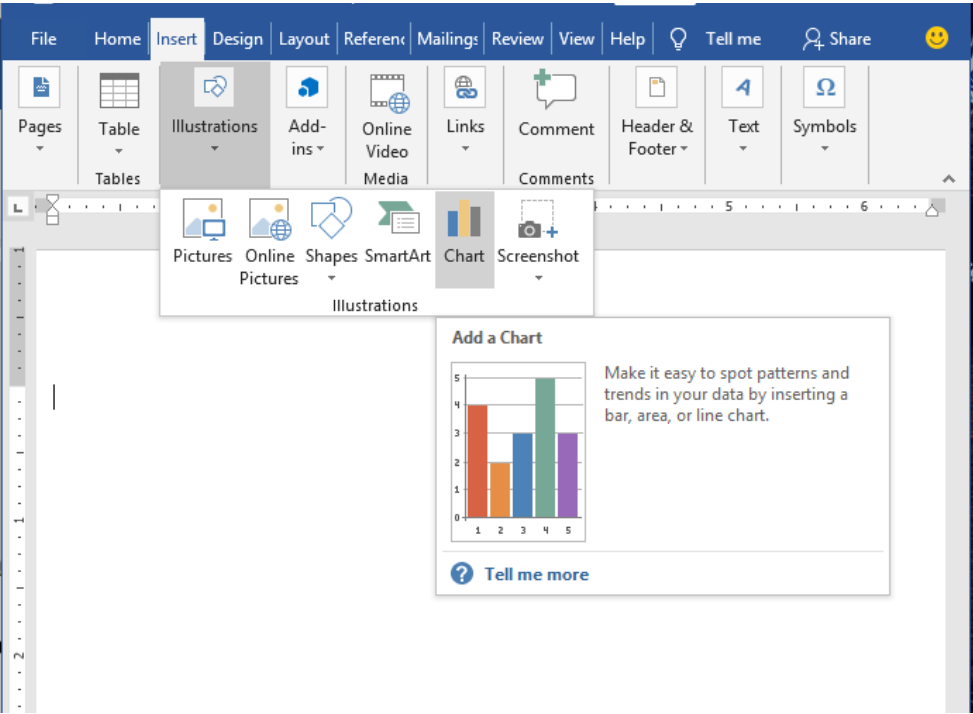 Figure 3 – Microsoft Word charts
- We will find the Insert Chart dialog box where we can select from the different kinds of graphs or charts present including Histogram, bar, and Line. After picking, we click OK
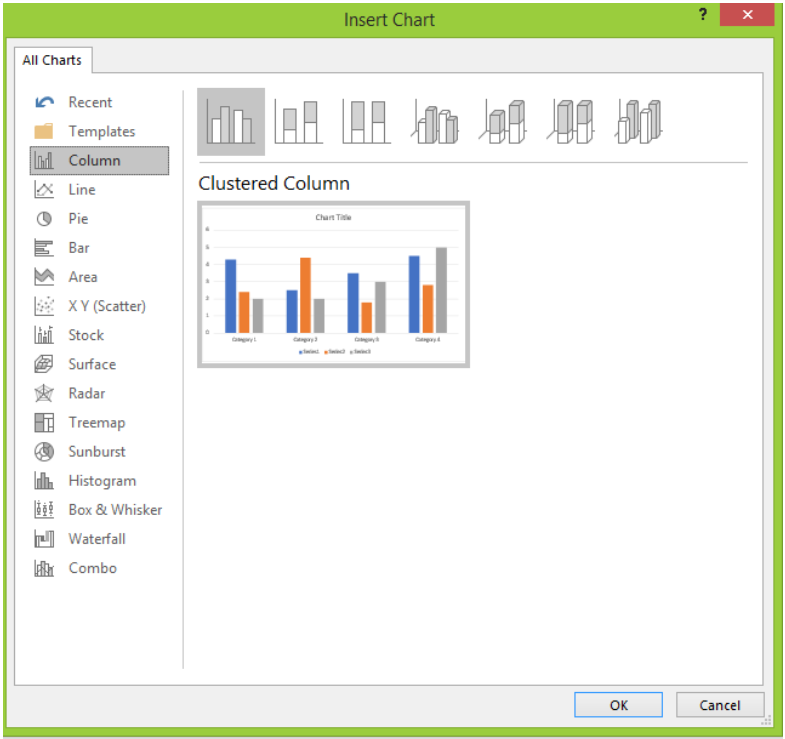 Figure 4 – Drawing a graph in Word
- Once, we are done, we will find our graph in the Word Document alongside a new Microsoft Excel Spreadsheet Window, where we can add, remove or modify our data.
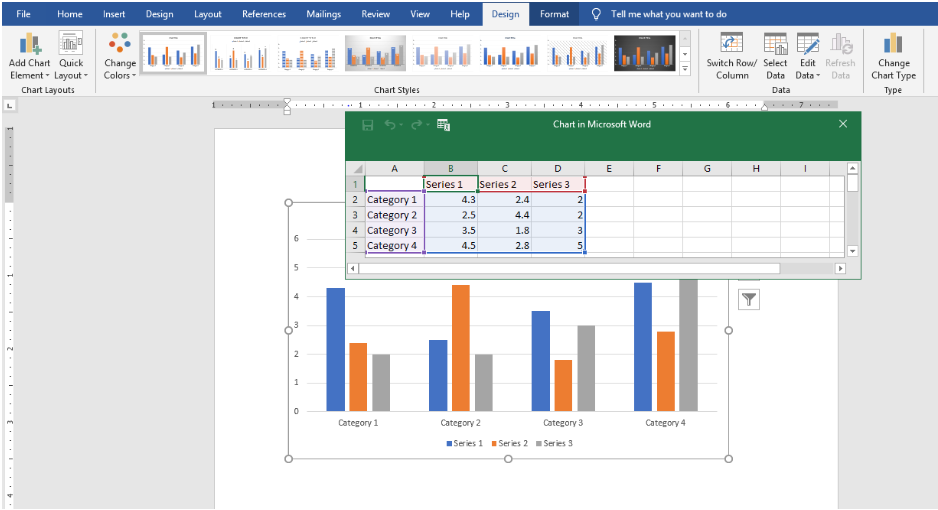 Figure 5 – Insert graph in Word
- When we have finished modifying the data, we will close the spreadsheet window
- In some cases where we may not find this window automatically, we may open it by right clicking on the chart and select Edit Data Button. In addition, whenever we wish to update our data, we can equally use the Edit Data option to do so.
 Figure 6 – Editing graph in Word
Creating charts from Table Data in Word
We may also create a chart from our normal table Data in MS-Word. Typically, older versions of Microsoft Word allowed us to right-click on any table and convert quickly to chart. But, with Word 2016, we can only have a new Excel Spreadsheet for every chart created. To get the same effect, we need a Microsoft graph chart object. To create a chart from the Table:
- We highlight the entire table, go to the Insert tab and select Object in the Text section
 Figure 7 – How to do a graph in Word
- Next, we tap the Microsoft Graph Chart and click OK.
 Figure 8 – How to create a chart in Word from an existing table
- Word will launch the Microsoft Graph Window, changing in the process while creating a chart from our table automatically. Here, we can modify our data sheet if necessary
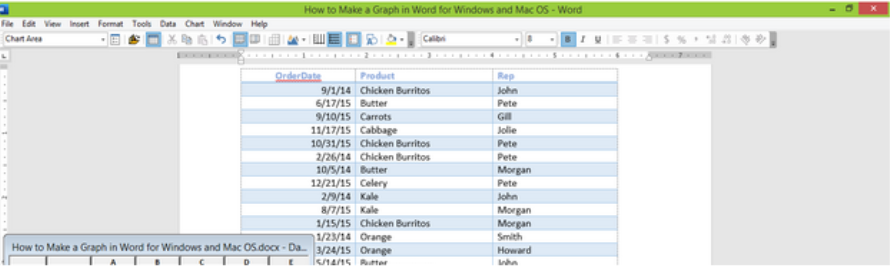 Figure 9 – Drawing graph on Word
- If we wish to change the type of chart, we will double-click on the chart and select Chart Type.
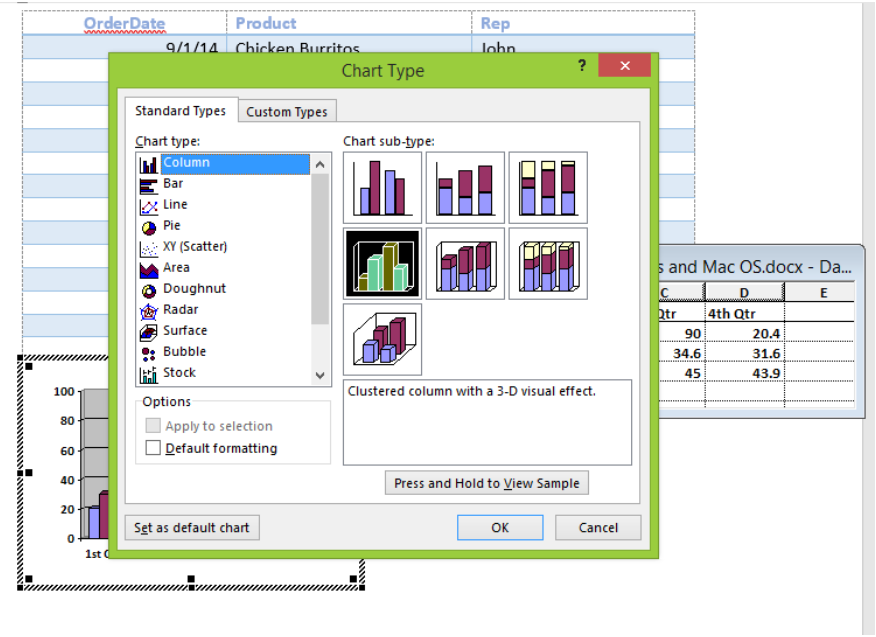 Figure 10 – Creating a chart in Word
- This will provide the Chart Type dialog box with several options. Once we have the one that suits us, we click OK.
How to make a chart in Microsoft word by transferring a chart from Excel
- We will create a chart or graph in Microsoft Excel
- We will select the entire chart
- We will copy the chart by using Ctrl + C or right-click on the graph and select copy
- In our word document, we will place our cursor where we want to add the chart.
- We will right click and select the paste option to insert our graph
Explanation
Microsoft Word has different functionalities including the ability to add graphs easily. However, graphs created in Microsoft Excel and added to MS-Word may not come with their spreadsheet. This is typically seen in MS-Word 2013 and below. For MS-Word 2016, we may be able to modify the chart or graph after placing in the document.
Instant Connection to an Excel Expert
Most of the time, the problem you will need to solve will be more complex than a simple application of a formula or function. If you want to save hours of research and frustration, try our live Excelchat service! Our Excel Experts are available 24/7 to answer any Excel question you may have. We guarantee a connection within 30 seconds and a customized solution within 20 minutes.


Leave a Comment