

Excel offers some forecasting tools that help us predict future values based on historical data and trends. In Excel 2016, forecasting has been made easier with the Forecast Sheet feature. We can create a forecast with a table and chart showing the forecasted values.
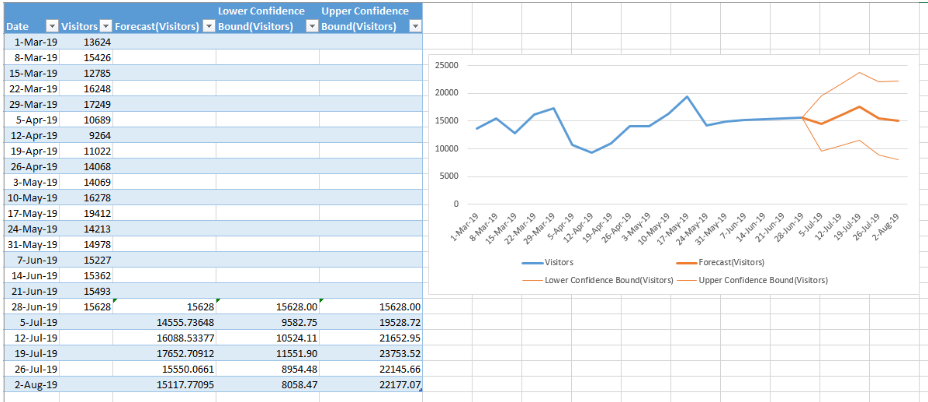 Figure 1. Final result: Forecasting in Excel
How to create a forecast sheet
- Select the historical data where we will base our forecast
- In the Data tab, select Forecast Sheet under the Forecast group
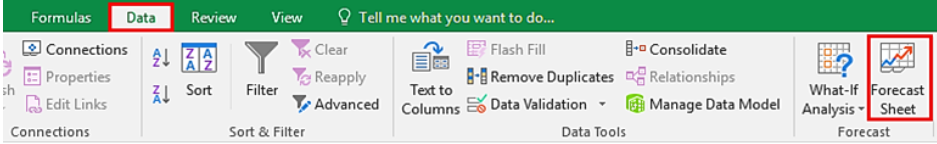 Figure 2. Forecast Sheet option in Data tab
A chart will appear showing the existing data points (blue line graph) and the predicted values (orange line graph). Note that there are three graphs for the predictions: one for the forecast, one for the lower confidence bound and another one for the upper confidence bound.
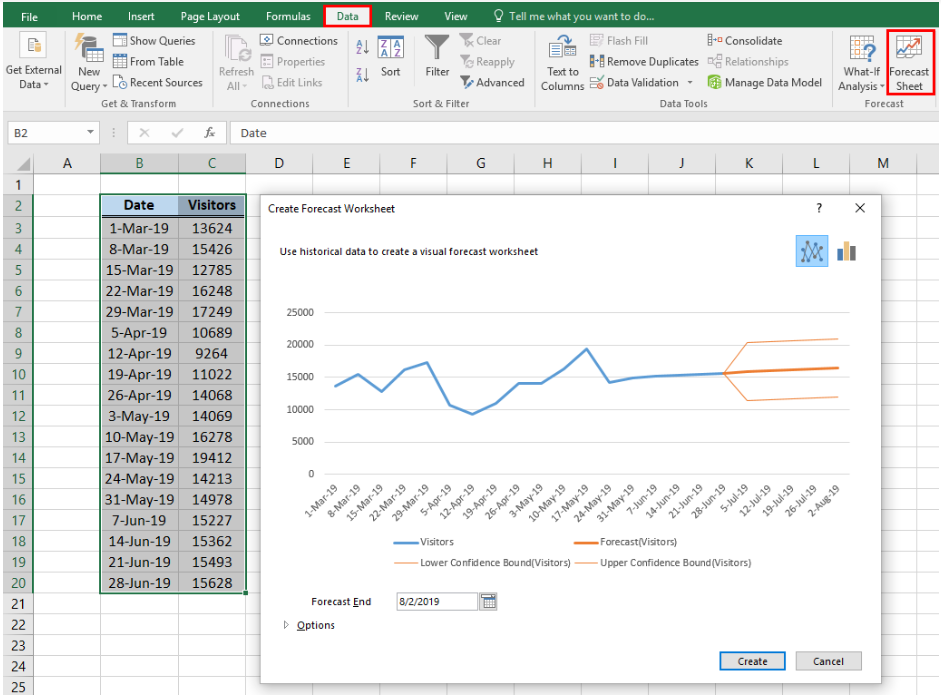 Figure 3. Creating a Forecast Sheet
- In the Create Forecast Worksheet dialog box, we can change the Forecast End date. Click Options to set the Confidence Interval and Seasonality. For this example, we set the seasonality to 4 to stand for 4 weeks in one month.
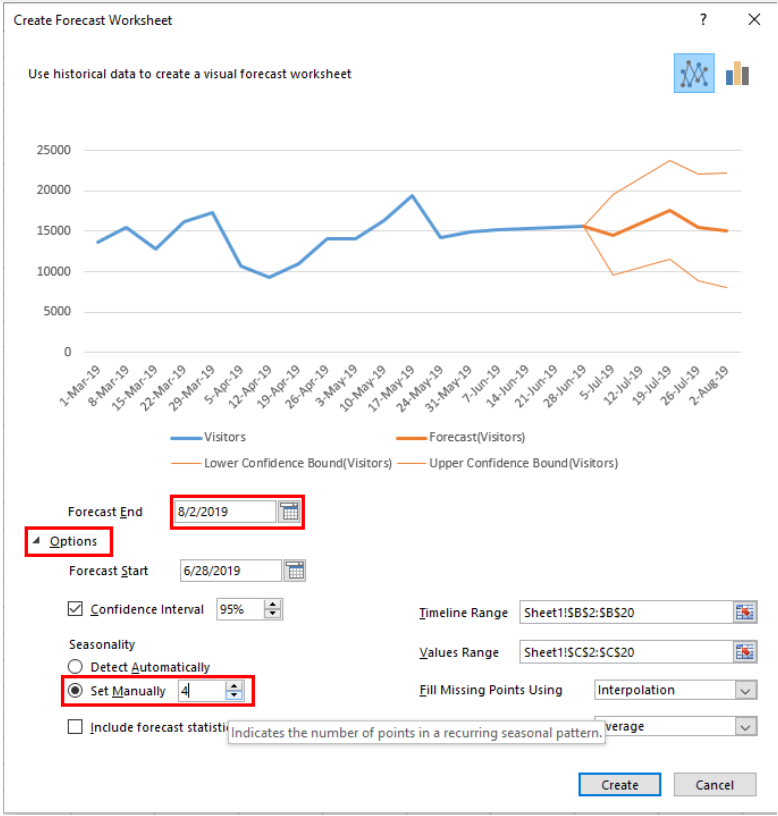 Figure 4. Create Forecast Worksheet dialog box
- Click Create
We have now created a forecast sheet showing the historical data and the predicted values for July 5 to August 2.
 Figure 5. Output: Create a Forecast Sheet
Forecast formulas
Aside from Forecast Sheet, the functions FORECAST.ETS and FORECAST.LINEAR can also be used as forecasting tools.
Syntax of FORECAST.ETS
=FORECAST.ETS(target_date, values, timeline, [seasonality], [data_completion], [aggregation])
FORECAST.ETS is the function used in a forecast sheet and it uses exponential smoothing method. In the table below, we enter this formula in D20:
=FORECAST.ETS([@Date],$B$2:$B$19,$A$2:$A$19,4)
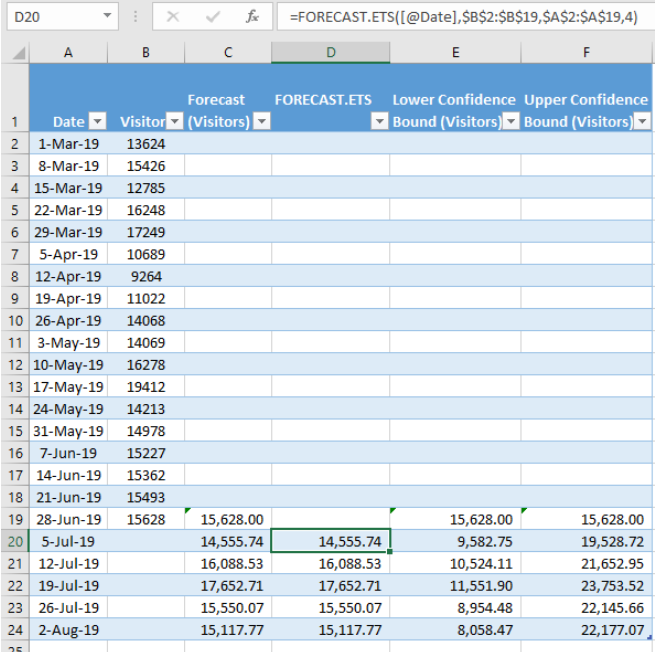 Figure 6. Entering the FORECAST.LINEAR formula
As shown in the table above, the forecast values in column C automatically generated by creating a forecast sheet are equal to the results using the FORECAST.ETS function in column D. Hence, we can create our own exponential forecast by using the FORECAST.ETS function.
FORECAST.LINEAR is another statistical function that is used to forecast values along a linear trend or based on linear regression. This is useful when our existing data is not enough to constitute a seasonal pattern.
Syntax of FORECAST.LINEAR
=FORECAST.LINEAR( x,known_y’s,known_x’s)
- x – The period or date for which we want to forecast
- Known_x’s – the period or dates in our historical data
- Known_y’s – the historical data where we will base our forecast
The image below shows sales projection using a formula with FORECAST.LINEAR.
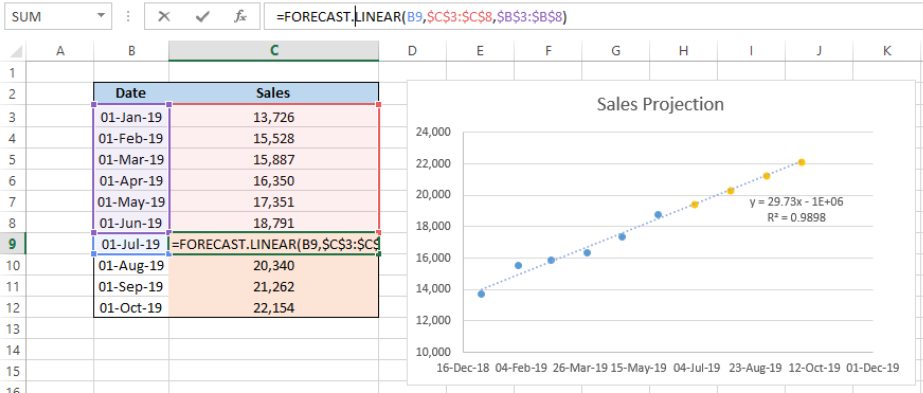 Figure 7. Linear trend using FORECAST.LINEAR
Instant Connection to an Excel Expert
Most of the time, the problem you will need to solve will be more complex than a simple application of a formula or function. If you want to save hours of research and frustration, try our live Excelchat service! Our Excel Experts are available 24/7 to answer any Excel question you may have. We guarantee a connection within 30 seconds and a customized solution within 20 minutes.


Leave a Comment