

We can calculate exponents in excel by using a formula. We can plot exponential graphs by converting our table of data into the graph. This tutorial will guide all levels of excel users on how to calculate exponential in excel and then plot a graph.
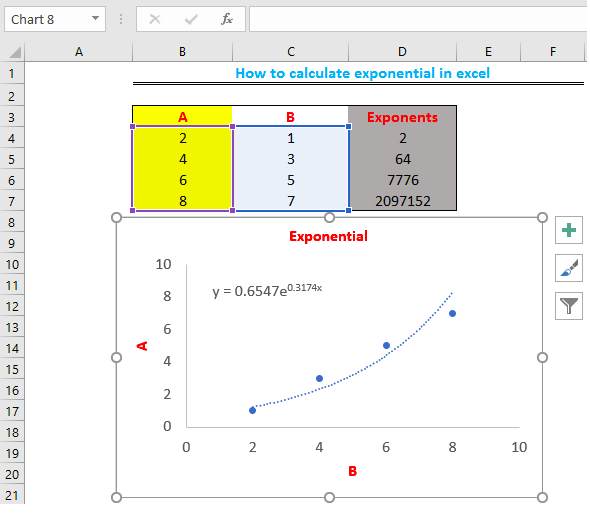 Figure 1: How to calculate exponents in excel
Tabulate Data
We will tabulate our data in two columns and create a third column for our exponential values.
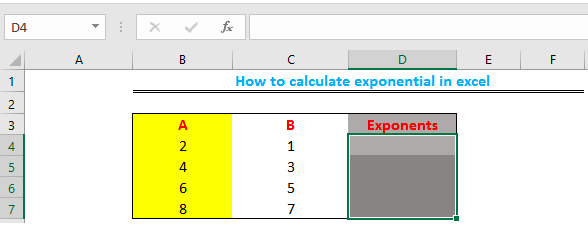 Figure 2: Table of Data
- We will click on Cell D4 and type the exponential formula
=POWER(B4,C4) - We will press enter. The result is 2 raised to the power of 1 (21)
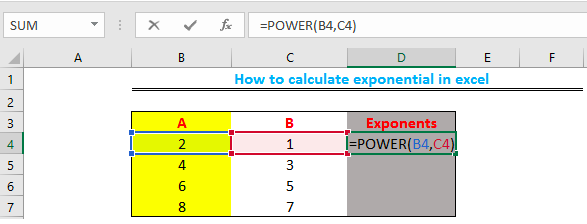 Figure 3: Exponent of Cell B4
- We can also input the formula “
=POWER(C4,B4)” to calculate the exponential function of “Cell C4”. The result will be 1 raised to the power of 2 (12)
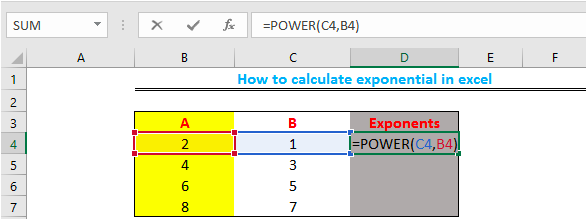 Figure 4: Exponent of Cell C4
- We will drag the fill handle (the small box at the bottom-right of Cell D4 in figure 3) to copy the formula to Cell D7.
Note: For this tutorial, we will only calculate the exponential function of Cell B4.
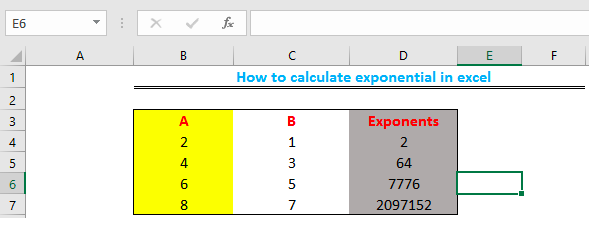 Figure 5: Exponent of other cells (D5, D6, and D7)
How to Plot the Exponential Graph
- We will highlight the data in Column A and Column B, then we will click on “insert” and select “scatter chart”
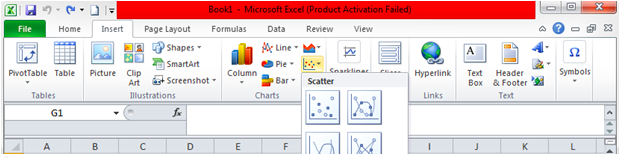 Figure 6 – Scatter chart
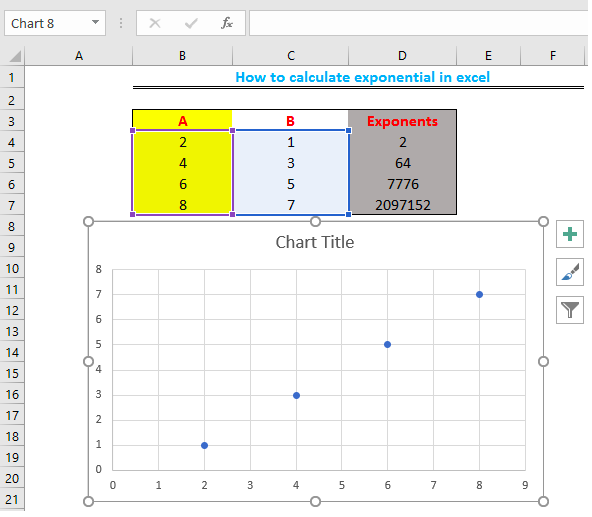 Figure 7: Exponential Graph
- We will click on the “+” icon beside the chart to edit our graph by including the Chart Title and Axes. We will also remove the gridlines.
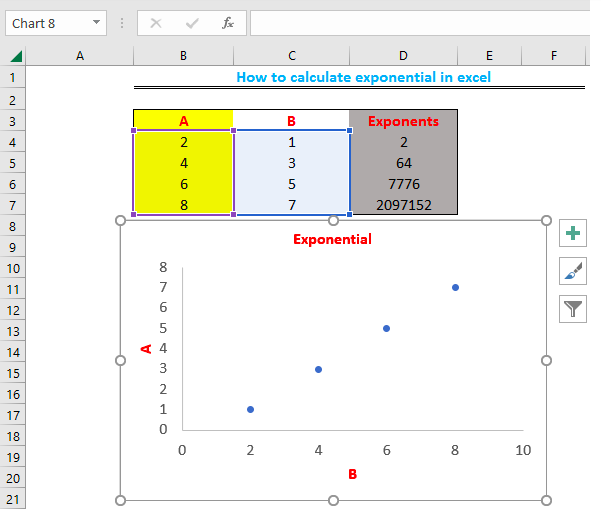 Figure 8: Edited Graph Parameters
- We will now plot the exponential curve by right-clicking on any point on the chart. We will select “add trendline”. We will select “exponential” on the parameters displayed by the right side of the page, then scroll down and finally select “Display Equation on Chart”.
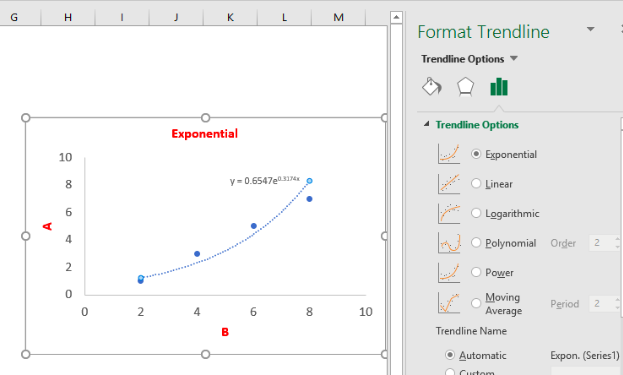 Figure 9: Plot of the Exponential Curve
Instant Connection to an Expert through our Excelchat Service
Most of the time, the problem you will need to solve will be more complex than a simple application of a formula or function. If you want to save hours of research and frustration, try our live Excelchat service! Our Excel Experts are available 24/7 to answer any Excel question you may have. We guarantee a connection within 30 seconds and a customized solution within 20 minutes.


Leave a Comment