

We use Exponential smoothing to achieve a more realistic forecast where we have nonlinear models with recurring or seasonal patterns. The Exponential smoothing is based on the additive trend, additive seasonality, and additive error. It is one of the top 3 sales forecasting methods used in the field of statistics. In this tutorial, we will learn how to carry out exponential smoothing at different damping factors.
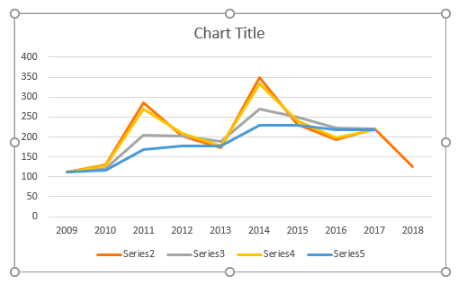 Figure 1 – Exponential Smoothing Example
How to do Exponential Smoothing
We will use Exponential Smoothing to do a sales forecast for 2019 using 10 years of revenue data. First, we will enable the Data Analysis tab, followed by creating a simple data table and lastly, do the Exponential smoothing of the data table
1. We will enable the Analysis ToolPak;
- We will go to File and then select Options
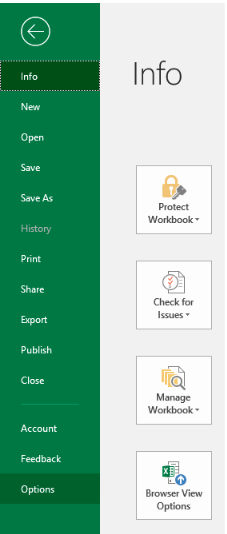 Figure 2 – Enabling Data Analysis
- We will select Add-ins from the Options dialog window
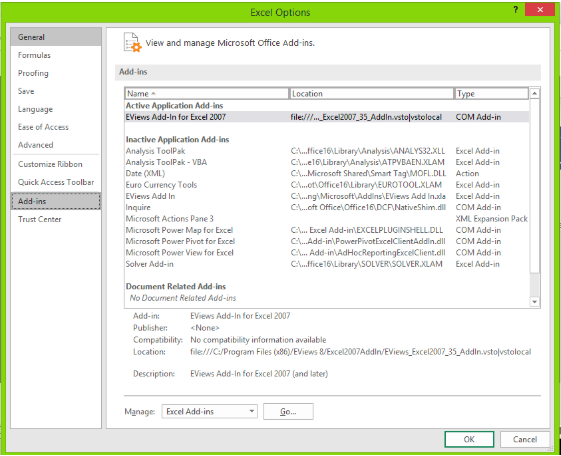 Figure 3 – Turn on Analysis Toolpak
- In the Add-ins dialog box, we will select Analysis Toolpak and click OK
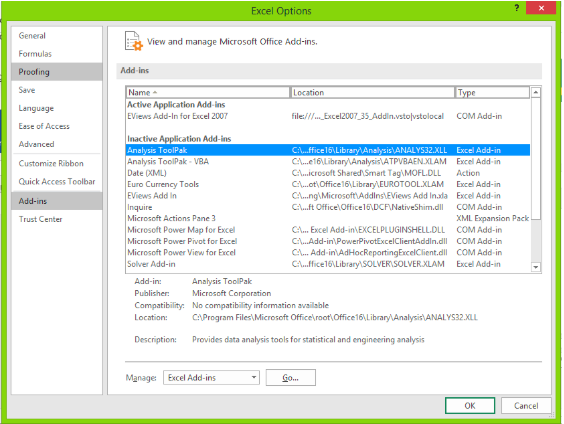 Figure 4 – Excel Smoothing using Data Analysis
- When we navigate to the Data tab, we will find the Data Analysis button
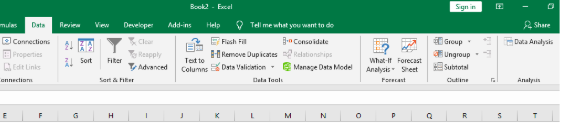 Figure 5 – Exponential Smoothing forecast using the Data Analysis button
2. We will set up a simple data table as shown below
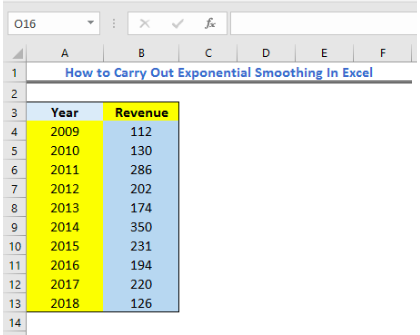 Figure 6 – Setting up data smoothing in Excel
3. Now, we will carry out the Exponential Smoothing
- We will click on Data Tab and select Data Analysis
- In the Data Analysis Window, we will select the Exponential Smoothing Option
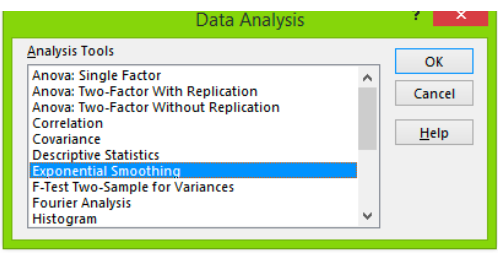 Figure 7 – How to do exponential smoothing
- In the Input Range text box, we will specify the available data points. Our data range is $B$3:$B$13
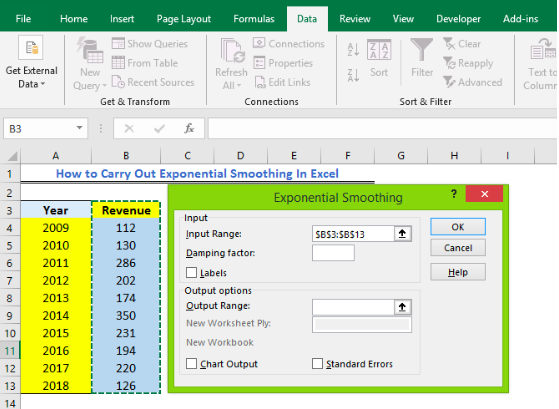 Figure 8 – Excel Exponential Smoothing
- Next, we will set the damping factor between 0 to 1 to smooth out the graph and values. For our tutorial, we will set 0.5 as the damping factor
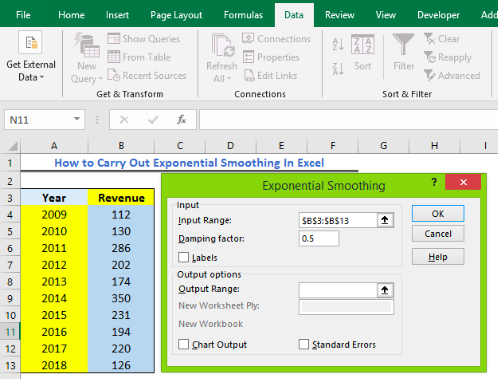 Figure 9 – Data smoothing forecast example
- Because we selected our heading, we will have to tick the labels checkbox
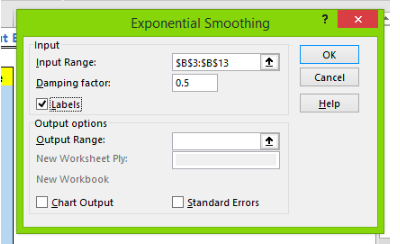 Figure 10 – Preparing to run data smoothing
- Next, we will select where we want to have our result displayed. Here, we will pick $C$3
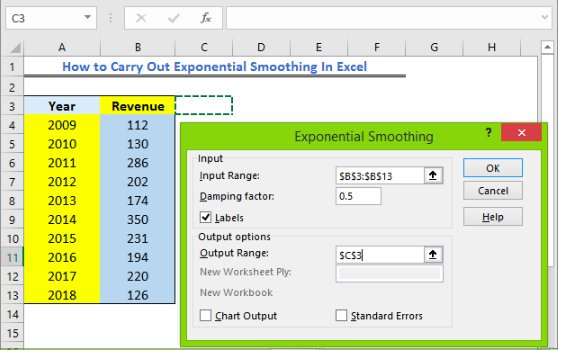 Figure 11 – Excel Exponential forecast
- Now, we must select whether we want to display our data graphically or not. In this tutorial, we will display our data graphically. To do so, we will mark the checkbox for Chart Output
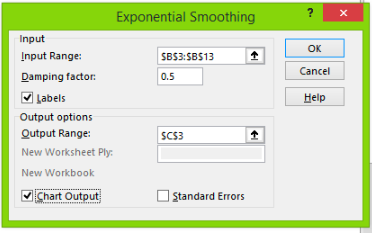 Figure 12 – Exponential Smoothing
- After completing all field, we will select OK
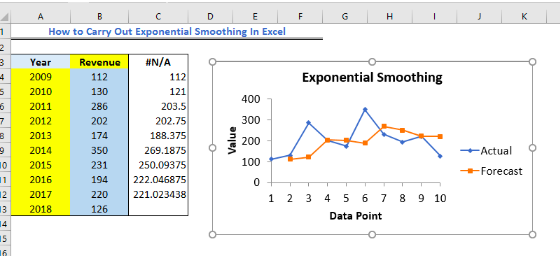 Figure 13 – Exponential smoothing forecast example
Running Exponential Smoothing Analysis for different damping factors
We can equally run exponential smoothing for different damping factors. Using our result from the first example, we will run exponential smoothing for 0.1 and 0.7
1. We will use Data Table results from the earlier example.
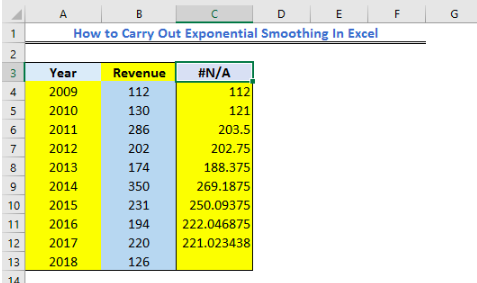 Figure 14 – Exponential Smoothing Data Table
- Next, In the Data Analysis Window, we will select the Exponential Smoothing Option
- We will specify the Input Data Range as below.
- We will set 0.1 as the damping factor
- Because we selected our heading, we will have to tick the labels checkbox
- Next, we will select where we want to have our result displayed. Here, we will pick Cell $D$3
- We will unmark the checkbox for Chart Output
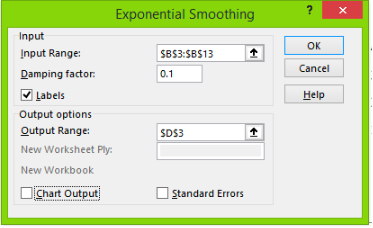 Figure 15 – Exponential smoothing forecast example
- After completing all field, we will select OK
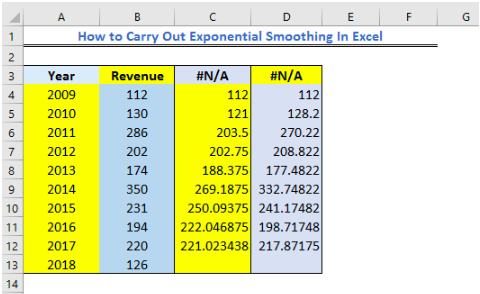 Figure 16 – Exponential Smoothing Example
Again, we will run the exponential smoothing at 0.7.
- We will use Data Table results from the earlier example.
- Next, in the Data Analysis Window, we will select the Exponential Smoothing Option
- We will specify the Input Data Range as below.
- We will set 0.7 as the damping factor
- Because we selected our heading, we will have to tick the labels checkbox
- Next, we will select the Output Range where we want to have our result displayed
- We will unmark the checkbox for Chart Output
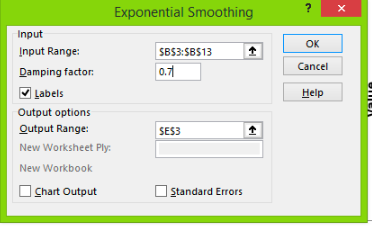 Figure 17 – Using excel exponential smoothing
- We will click OK
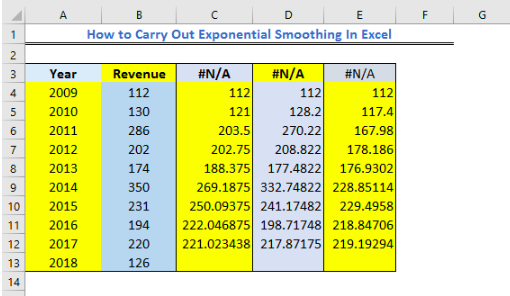 Figure 18 – Tabular result from Excel Exponential Smoothing
2. Using our final table, we will draw a graph.
- We will highlight the entire table and go to the Insert Tab, where we will pick the 2-D Line graph
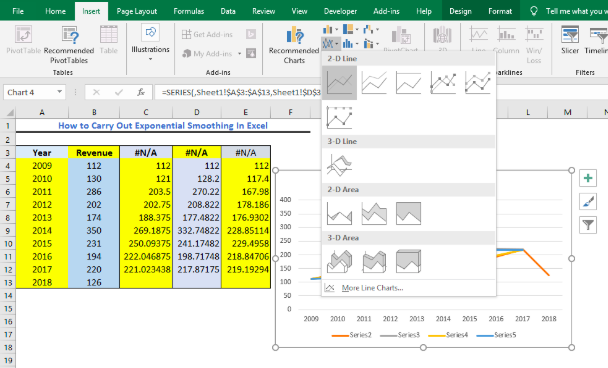 Figure 19 – How to do exponential smoothing
- We will click OK
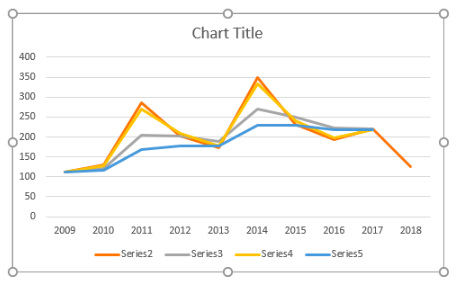 Figure 20 – Result of carrying out excel exponential smoothing
Instant Connection to an Excel Expert
Most of the time, the problem you will need to solve will be more complex than a simple application of a formula or function. If you want to save hours of research and frustration, try our live Excelchat service! Our Excel Experts are available 24/7 to answer any Excel question you may have. We guarantee a connection within 30 seconds and a customized solution within 20 minutes.


Leave a Comment