

Error bars are a great addition to any chart, and represent the precision or variability of data. They are used to show the uncertainty or range of error in a specific data point or measurement.
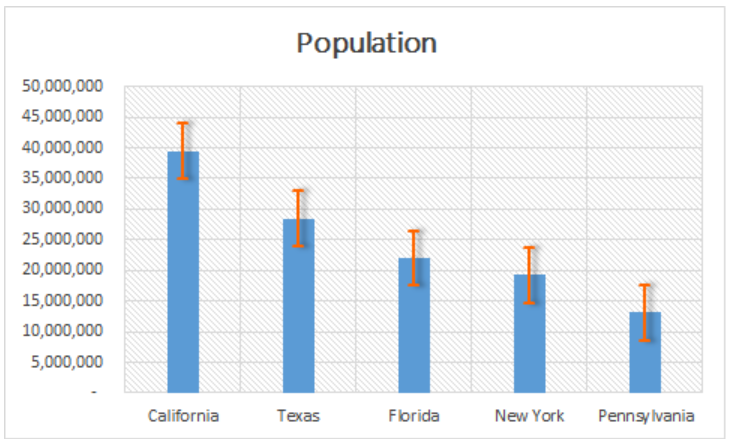 Figure 1. Final result: How to add error bars
Excel has a built-in feature for error bars with three common error types: Standard Error, Percentage and Standard Deviation. This article will assist all levels of Excel users on how to add error bars.
How to add standard error bars
Below is a table and Clustered Columns chart of five US states and their population.
 Figure 2. Data for Error Bars
We want to plot the data and show the standard error for each state.
Insert error bars
- Click the chart
- Click Design tab > Add Chart Element > Error Bars > Standard Error
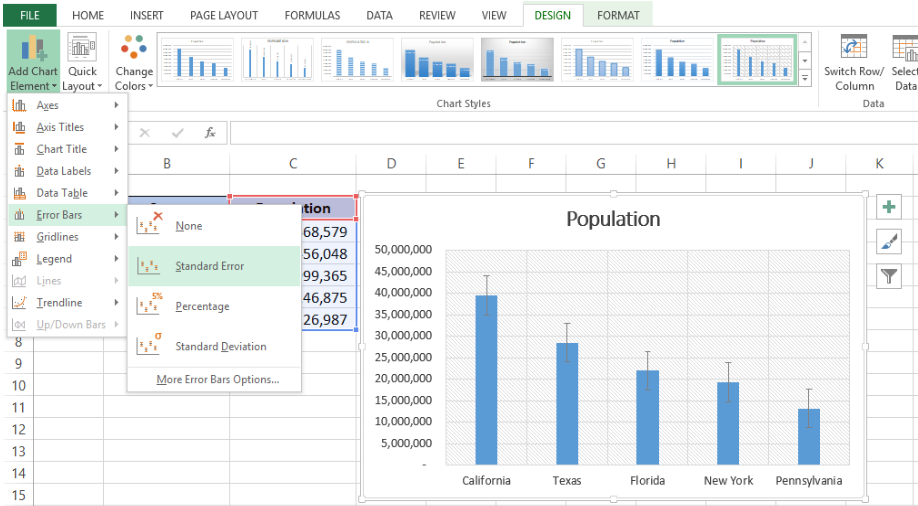 Figure 3. Standard Error Bars in Menu Options
Standard error bars are instantly added to our chart.
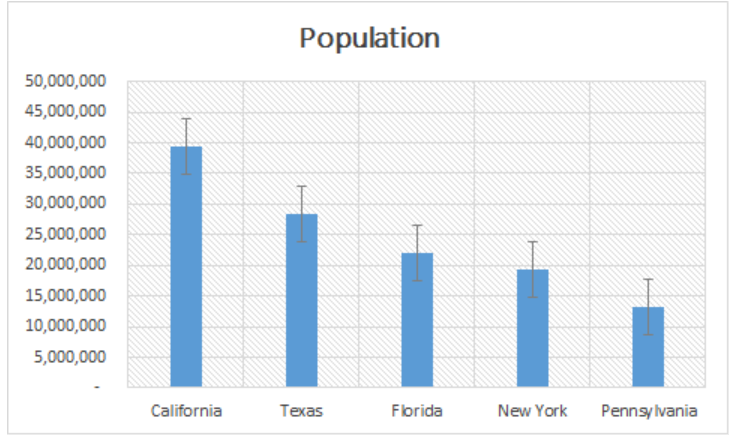 Figure 4. Output: Standard Error Bars
Standard deviation error bars
In order to add standard deviation error bars, we simply select Standard Deviation from the menu options under Error Bars.
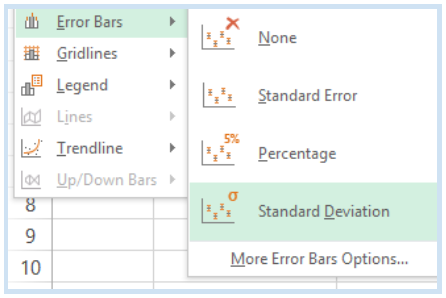 Figure 5. Standard Deviation Error Bars in menu options
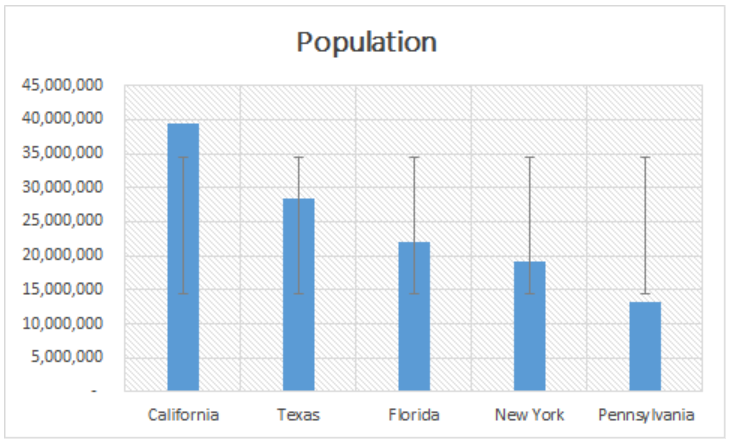 Figure 6. Output: Standard Deviation Error Bars
Percentage error bars
In the same way, percentage error bars may be inserted by the selecting Percentage in the Error Bars options.
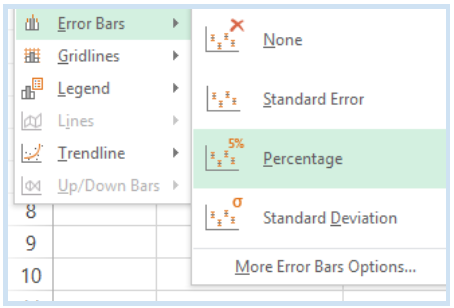 Figure 7. Percentage Error Bars in menu options
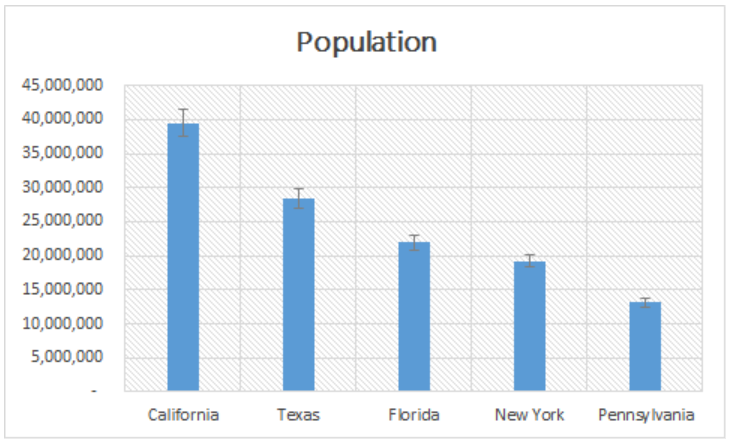 Figure 8. Output: Percentage Error Bars
Custom error bars
Excel also allows us to customize the error bars through any of the following methods:
- Right-click the error bars and select Format Error Bars from the options
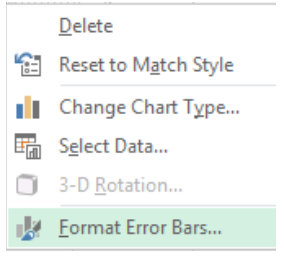 Figure 9. Format Error Bars menu options
- Double-click the error bars to launch the Format Error Bars dialog box
In Excel, error bars can be customized by:
- Customizing the format for error bar lines and effects such as shadow, glow and soft edges
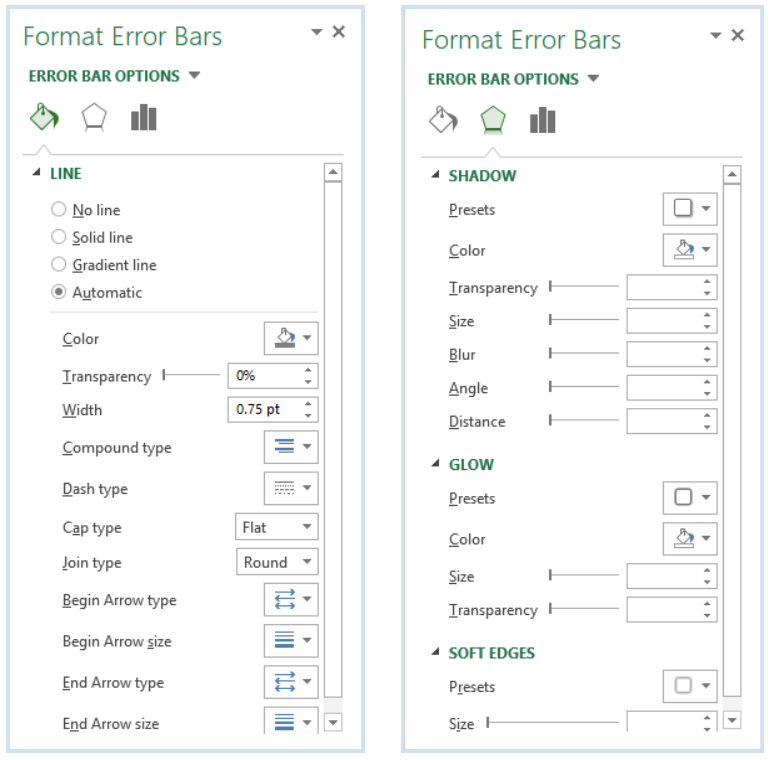 Figure 10. Error bars Line Formatting and Effects
- Customizing the properties for the vertical error bars:
- Choose the direction where the error bar appears (Plus – above the chart, Minus – below chart, or Both)
- End style – with or without cap
- Error Amount
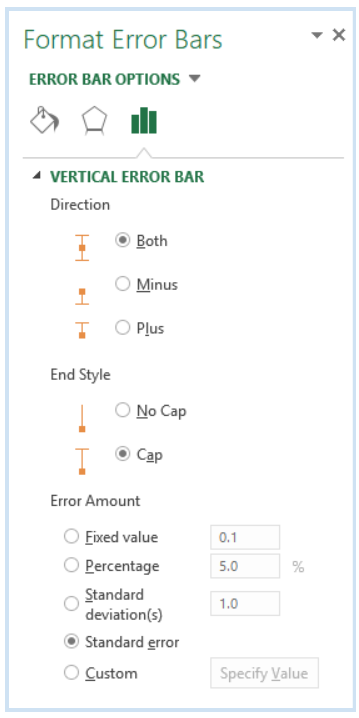 Figure 11. Vertical Error Bar Options
Custom error bar values
Although there are preset options for Error Bars, we can also add error bars with custom values. In the Format Error Bars dialog box, we can set the value for error bars by ticking Custom > Specify Value.
We can enter values for either Positive or Negative Error Value, or both.
Example:
Enter 10,000,000 for the Positive Error Value.
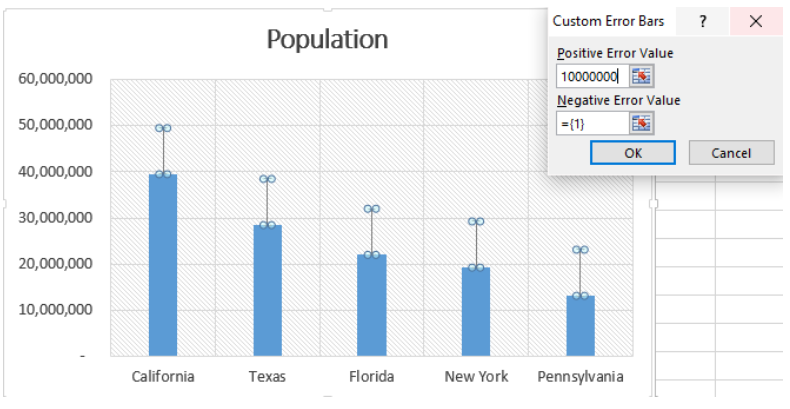 Figure 12. Output: Custom error bar values
As a result, an error bar is added above each of the charts, with a 10,000,000 value. We can further customize the error bars for improved visual effect by changing the line color and width, and adding shadows.
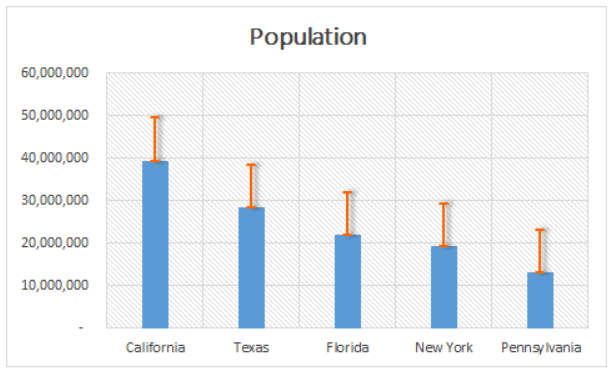 Figure 13. Output: Custom Error Bars
Instant Connection to an Excel Expert
Most of the time, the problem you will need to solve will be more complex than a simple application of a formula or function. If you want to save hours of research and frustration, try our live Excelchat service! Our Excel Experts are available 24/7 to answer any Excel question you may have. We guarantee a connection within 30 seconds and a customized solution within 20 minutes.


Leave a Comment