

We can create one variable data table or two variable data table with the What-If Analysis feature. This tutorial will walk all levels of excel users on how to create a one variable data table and a two variable data table.
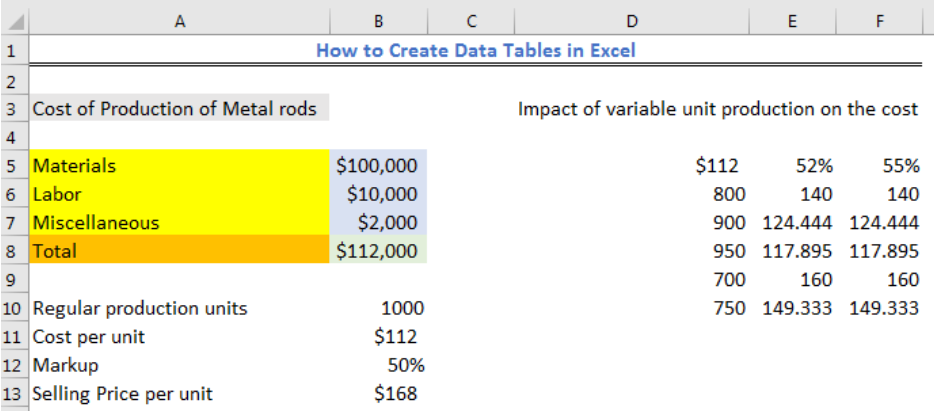 Figure 1 – How to make data table in Excel
What is a One Variable and Two Variable Data Table?
A one variable data table is a data table that has only one column or row of input values and multiple results while a two variable data table has two input values with only a single result.
How to Create a One-Variable Data Table
We will use the table in figure 2 to create a one-variable data table. We want to see how the cost per unit of item we produce will change. When the cost per unit of item increases, we might not be able to favorably compete with our competitors and when it reduces, we can compete. The table helps us to make business decisions.
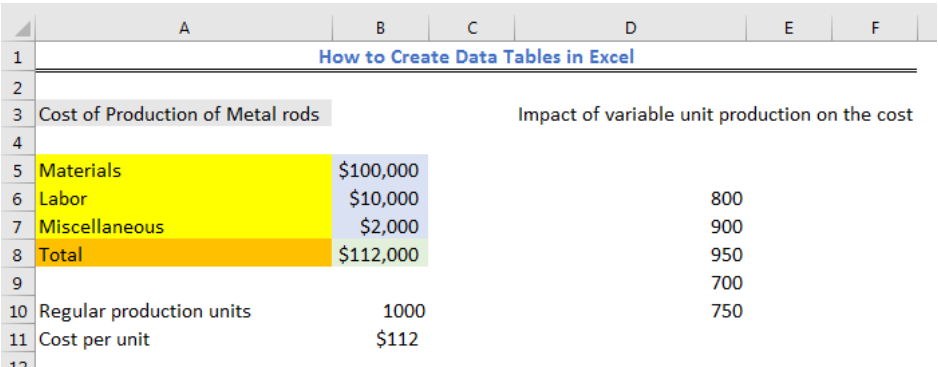 Figure 2 – How to Create a One-Variable Data Table
- The formula in Cell B11 is
=B8/B10 - We will input the name of the cell containing the formula in Cell E5 and press enter
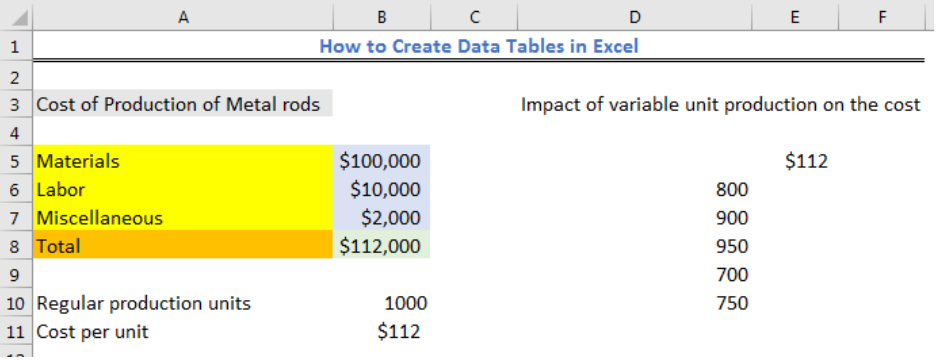 Figure 3 – One variable data table in Excel
- We will select Cell D5 to Cell E10
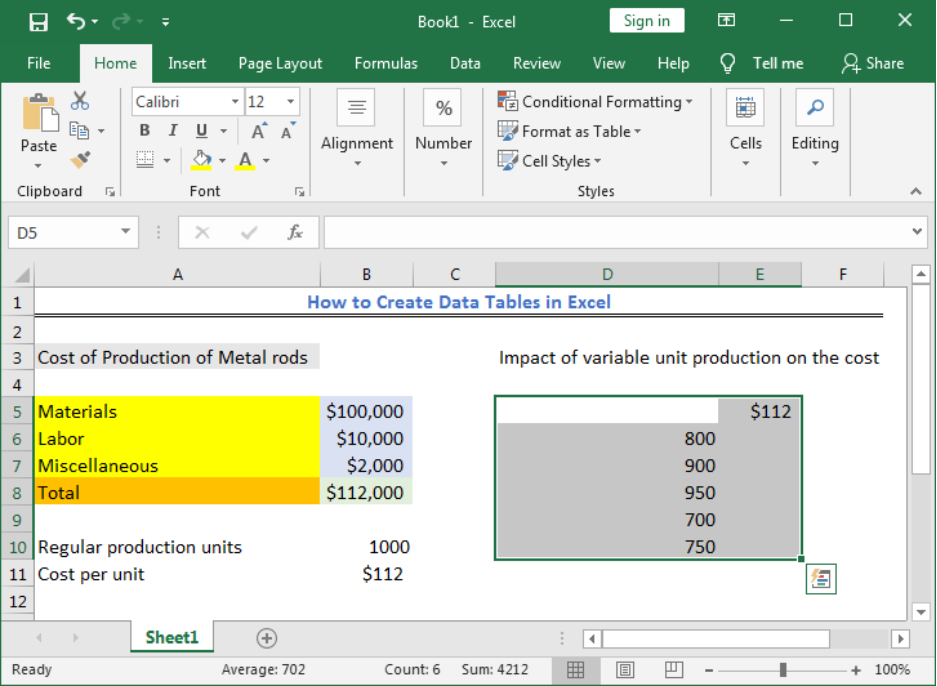 Figure 4 – How to create a one variable data table
- We will click on the Data tab and click on the What-If Analysis in the Forecast group
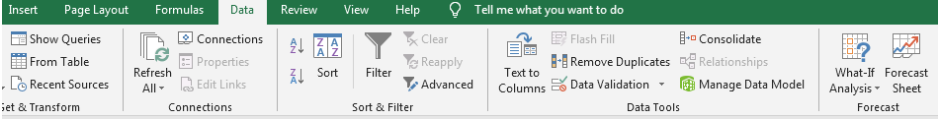 Figure 5 – Click What-If Analysis
- We will select Data Table from the drop-down
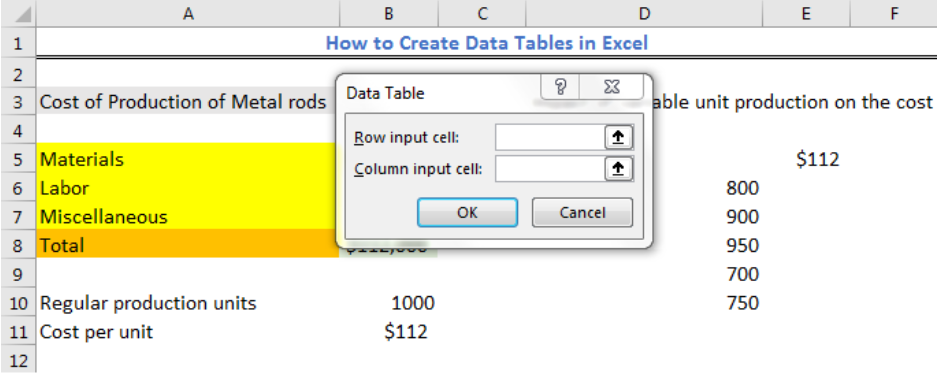 Figure 6 – Data table Excel dialog box
- We have only one variable that will change and that is the Regular Production Cost
- We will insert the Cell reference (B10) for the Column input Cell
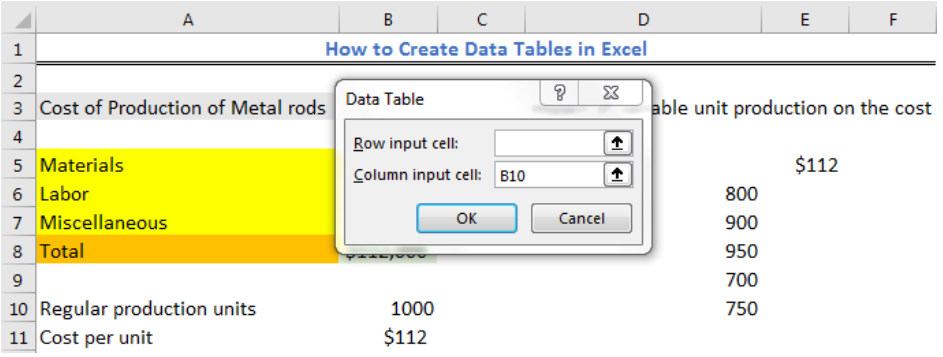 Figure 7 – Column Input Cell
- We will press OK
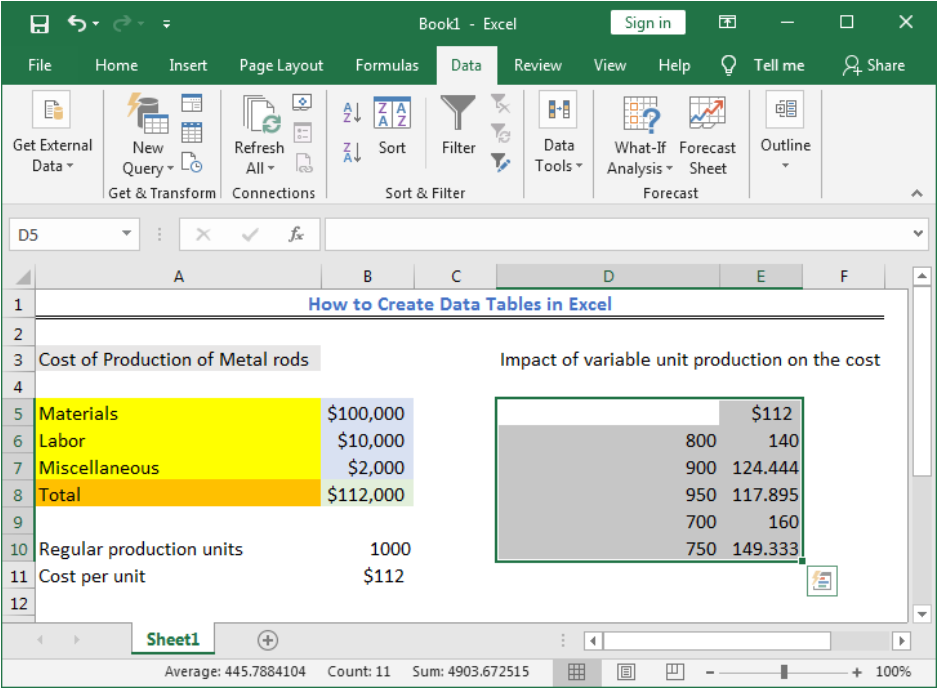 Figure 8 – One variable data table
The values show how the cost of producing a unit of metal rod will change when will produce only 800, 900, 950, 700, and 750 units respectively.
How to Create a Two-Variable Data Table
We will use the table in figure 9 to create a two-variable data table. We want to see how the cost per unit of item we produce will change taking into consideration the Regular Production cost and the markup. The markup tells us how much we can add to the production cost so we can set a favorable selling price.
- The formula in Cell B11 is
=B8/B10 - The formula in Cell B13 is
=B11+(B11*B12) - We will input the name of the cell containing the formula in Cell E5 and press enter
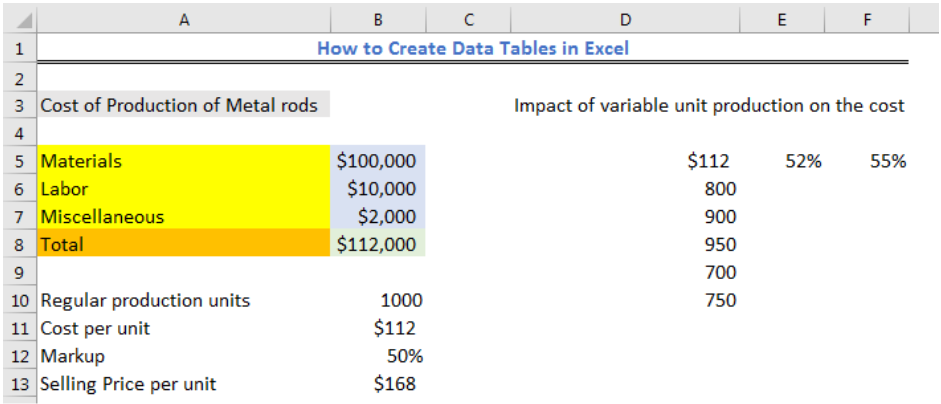 Figure 9 – How to Create a two-variable data
- We will select Cell D5 to Cell F10
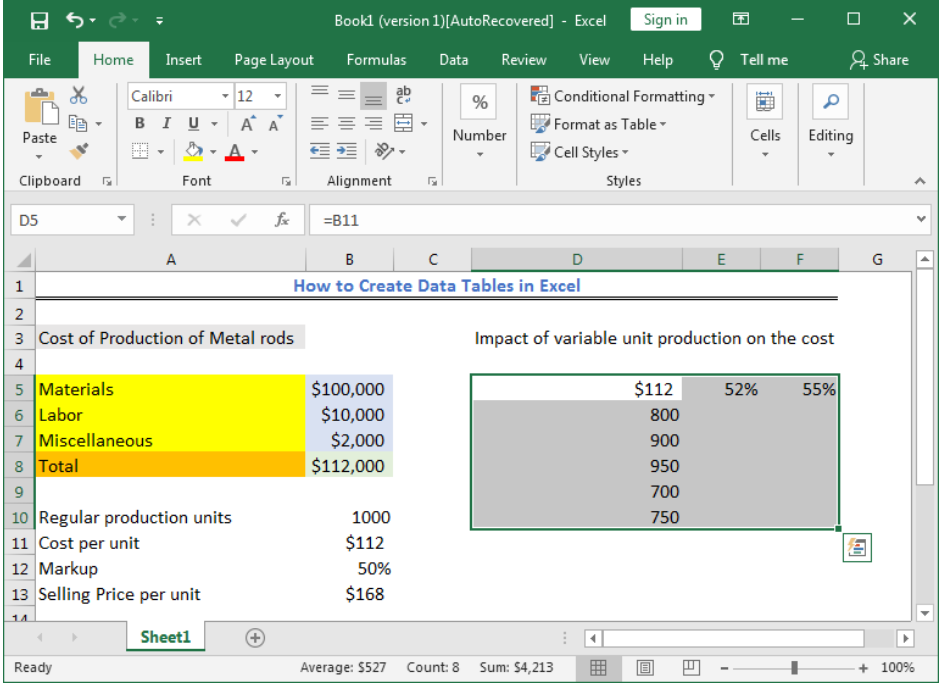 Figure 10 – How to create a two variable data table
- We will click on the Data tab and click on the What-If Analysis in the Forecast group
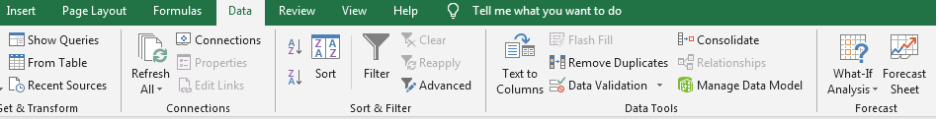 Figure 11 – Click What-If Analysis
- We will select Data Table from the drop-down
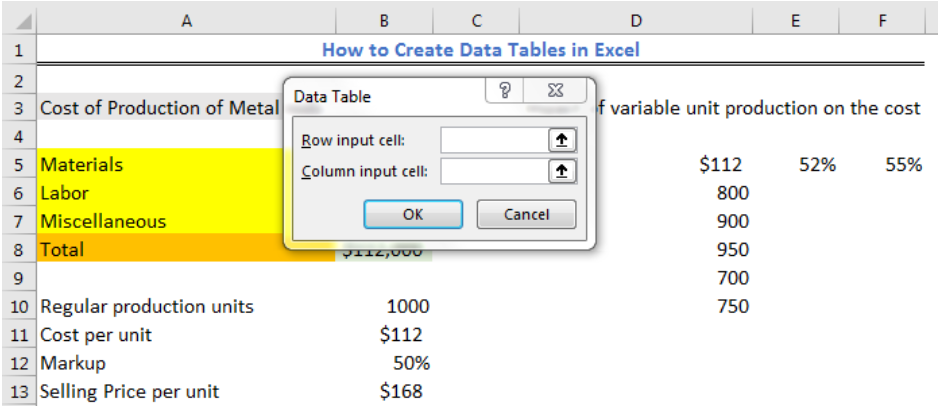 Figure 12 – Data table Excel dialog box
- We have only two variables that will change and that is the Regular Production Cost and the markup
- We will insert the Cell reference (B10) for the Column input Cell and Cell reference (B12) for the Row input cell
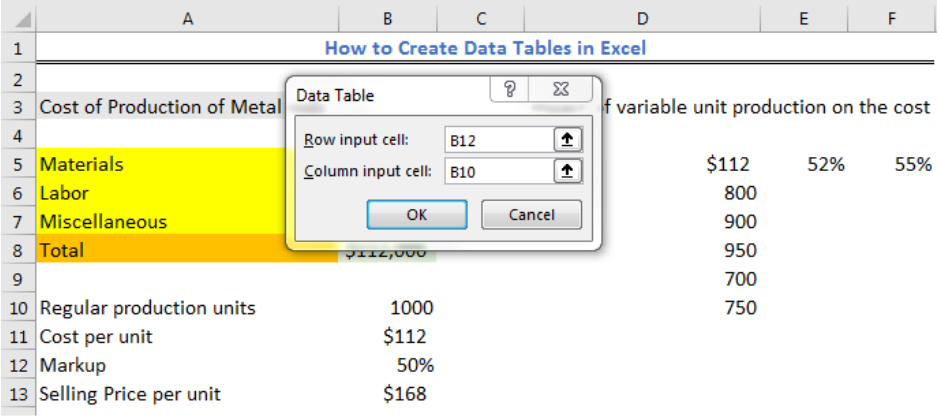 Figure 13 – Data table Excel dialog box
- We will press OK
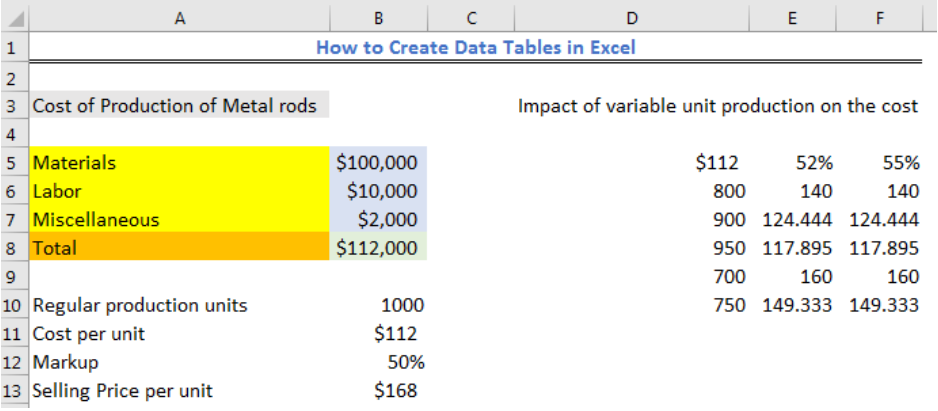 Figure 14 – Two variable data table
Instant Connection to an Excel Expert
Most of the time, the problem you will need to solve will be more complex than a simple application of a formula or function. If you want to save hours of research and frustration, try our live Excelchat service! Our Excel Experts are available 24/7 to answer any Excel question you may have. We guarantee a connection within 30 seconds and a customized solution within 20 minutes.


Leave a Comment