

A matrix is a set of numbers arranged in rows and columns in a specific format. We can construct a correlation matrix to measure dependency or relationships between two or more variables. In this tutorial, we will learn how to create a correlation matrix for two variables as well as multiple variable scenarios.
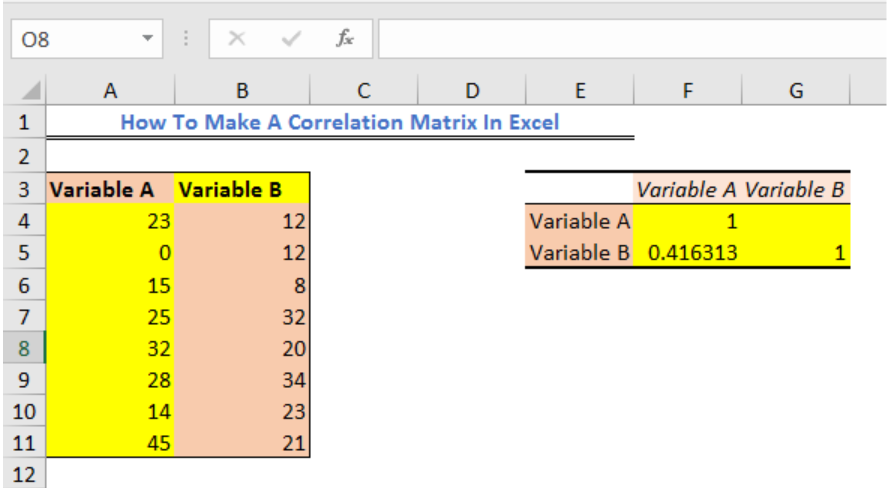 Figure 1 – How to create a correlation matrix in excel
Excel Correlation Matrix
The correlation matrix will show how one variable is dependent on the other variable. The resulting coefficients can be positive, negative, or zero. i.e., -1, +1 or 0. This means;
- “+1” – Positive correlation coefficient resulting when both variables are moving in the same direction
- “-1” – Negative Correlation coefficient resulting when the variables are moving in oppositive directions
- “0” or blank cell – Zero Correlation Coefficient when variables are not dependent on each other.
Correlation Matrix using Data Analysis
We need to enable the Analysis ToolPak to do the Correlation Matrix. We will go to File and select Options.
 Figure 2 – Making Excel Correlation Matrix.
- In the Add-Ins window, we will choose Excel Add-Ins from the Manage field and click Go.
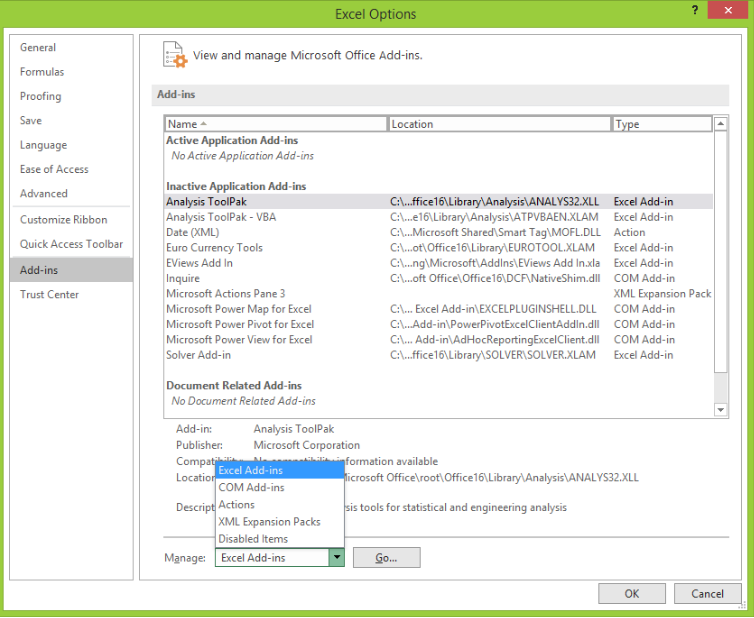 Figure 3 – Activating the Analysis ToolPak for creating a correlation matrix in excel
- Next, we will mark the option for Analysis ToolPak and click OK.
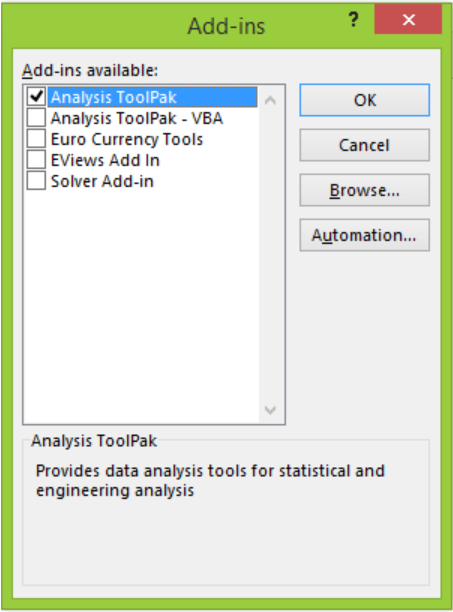 Figure 4 – Activating Analysis ToolPak for correlation in excel 2016
Create Correlation Matrix using two variables
- We will prepare our data table.
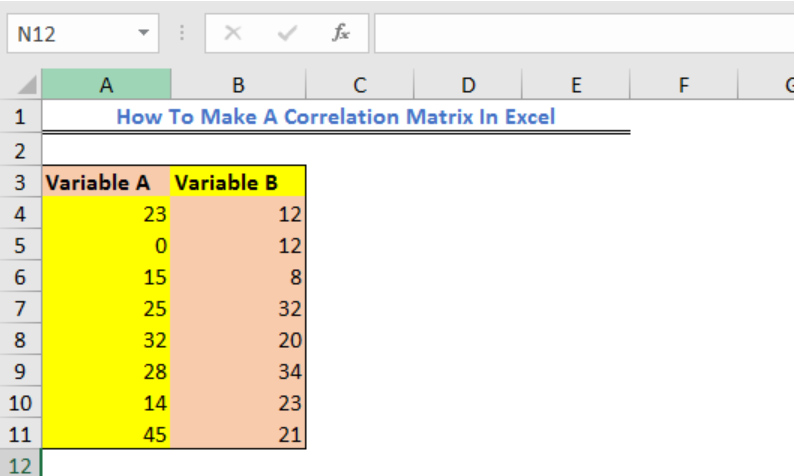 Figure 5 – How to make a correlation matrix in excel
- We will go to the Data Tab and select Data Analysis.
v 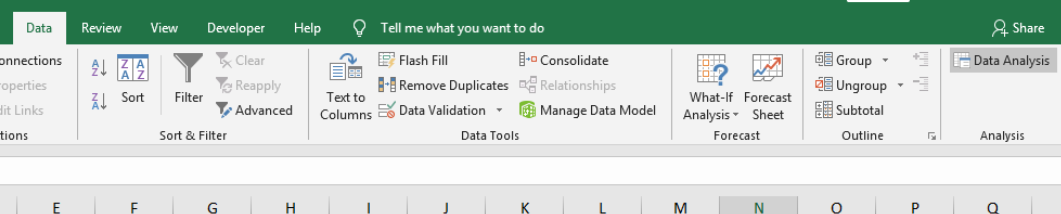 Figure 6 – Create Correlation Matrix in Excel
- In the Data Analysis pop-up window, we will select Correlation and select OK.
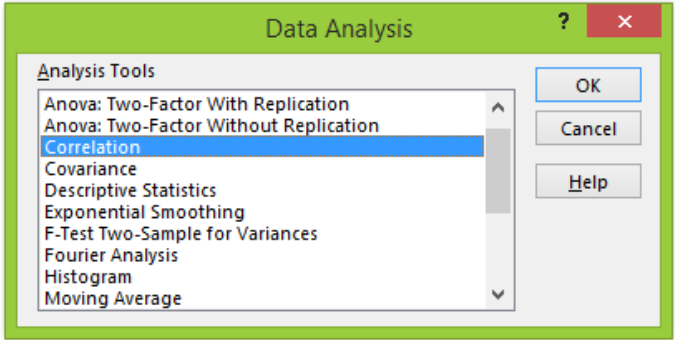 Figure 7 – Excel Correlation Matrix
-
- In the Correlation dialog box,
- we will select our data range
- In the Correlation dialog box,
- We will mark label in first row
-
- Next, we will select the Output range and finally select OK.
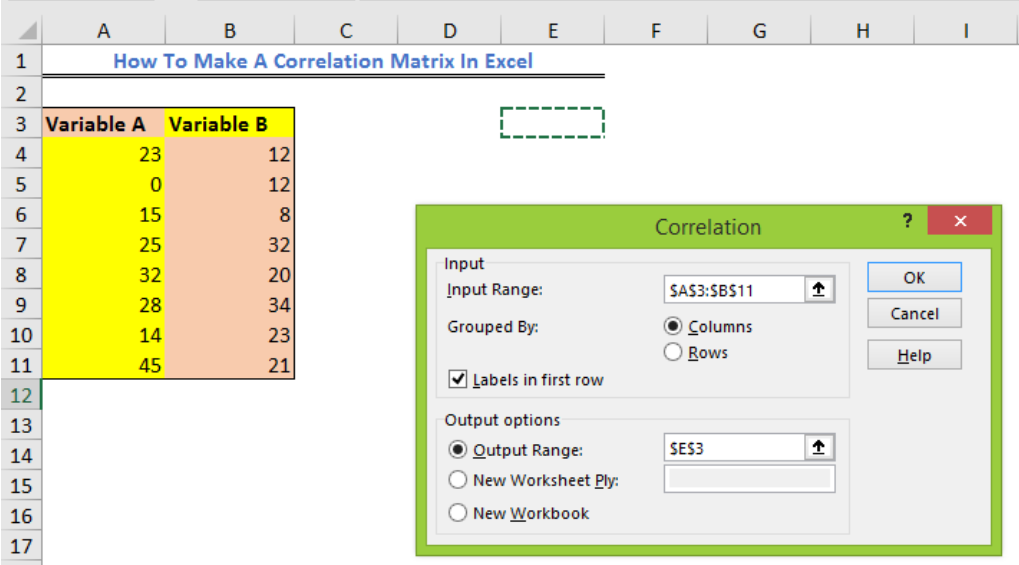 Figure 8 – How to do a correlation matrix in excel
- We will have this result
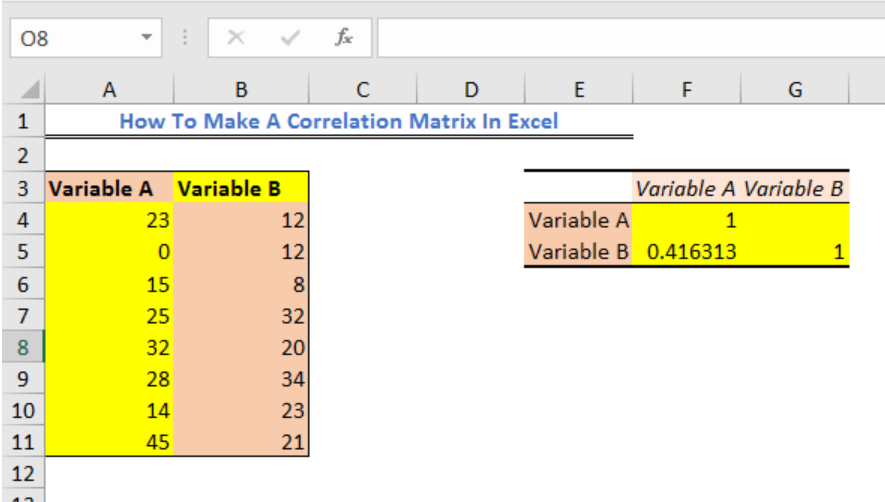 Figure 9 – How to Calculate a correlation matrix in excel
Correlation Matrix using multiple variables
- We will prepare our data table.
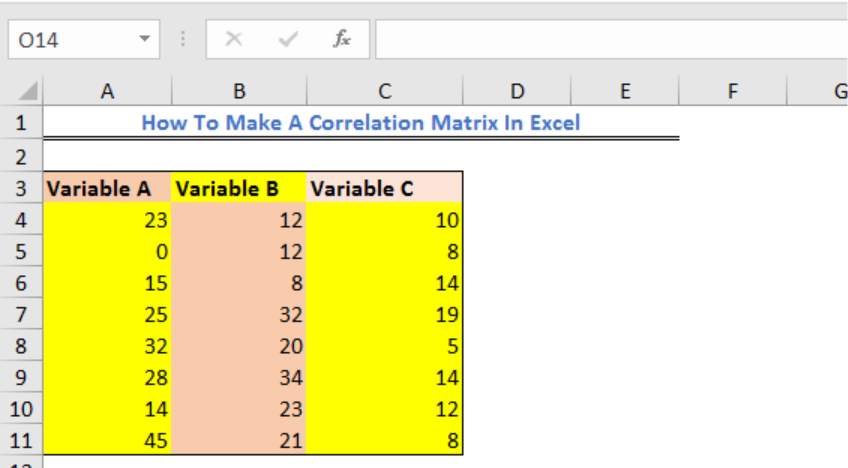 Figure 10 – How to do a correlation test in excel
- We will go to the Data Tab and select Data Analysis.
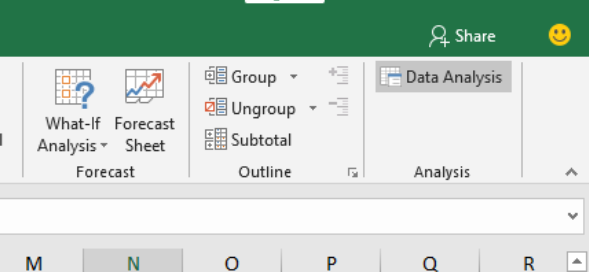 Figure 11 – Enable Data analysis for excel correlation matrix
- In the Data Analysis pop-up window, we will select Correlation and select OK.
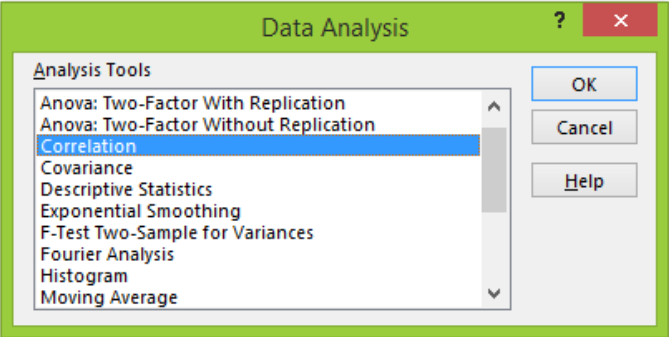 Figure 12 – Enable Correlation matrix in Excel
-
- In the Correlation dialog box,
- We will select our data range
- In the Correlation dialog box,
- We will mark label in first row
- Next, we will select the Output range and finally select OK.
Figure 13 – How to calculate the correlation matrix in excel
- We will have this result
Figure 14 – How to make a correlation matrix in excel
Instant Connection to an Excel Expert
Most of the time, the problem you will need to solve will be more complex than a simple application of a formula or function. If you want to save hours of research and frustration, try our Excelchat service! Our Excel Experts are available 24/7 to answer any Excel question you may have. We guarantee a connection within 30 seconds and a customized solution within 20 minutes.


Leave a Comment