

We can use BINOM.Dist function to calculate binomial distribution probably for a range of successes from a number of trials. The Binomial Distribution is a statistical measure used in displaying the probability of a specific number of successes from a particular number of independent trials. For example, we can use the Excel binomial distribution to calculate for the number of heads we can get in 100-coin tosses.
 Figure 1 – Example of binomial distribution in Excel
Binomial Distribution Formula
The syntax of the BINOM.DIST function is:
=BINOMDIST(number_s, trials, probability_s, cumulative)
Where
- Numbers_s – the number of successes we wish to calculate a probability
- Trials – the number of independent trials
- Probability_s – the probability of success in one trial
- Cumulative – the logical argument that specifies if we wish to calculate for the probability mass function or cumulative distribution function. This argument can have:
+ TRUE for cumulative distribution function and
+ FALSE for probability mass function.
How to do Binomial distribution
We can either calculate for the binomial distribution using cumulative distribution function or probability mass function. In this tutorial, we will do both using a single hypothetical data set.
We can set up a hypothetical data table as shown below:
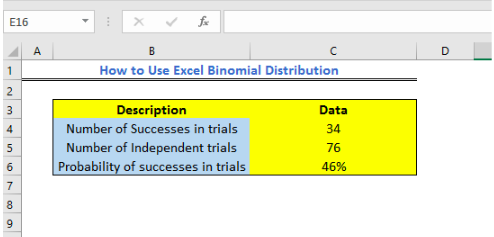 Figure 2 – Setting up data for Excel Binomial distribution
1. We will calculate for Binomial distribution using cumulative distribution function
a. We will enter the description in Cell B10 and insert the formula below in Cell C10.
=BINOM.DIST(C4,C5,C6,TRUE)
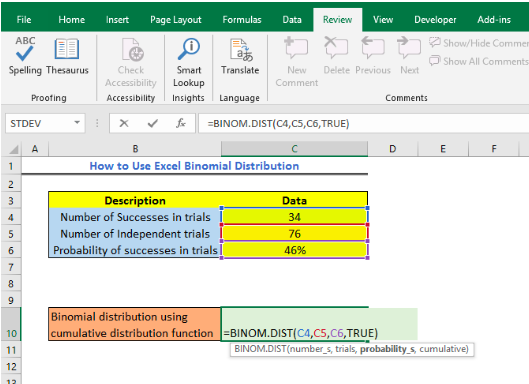 Figure 3 – How to Use Binomial Distribution
- We will get the result below
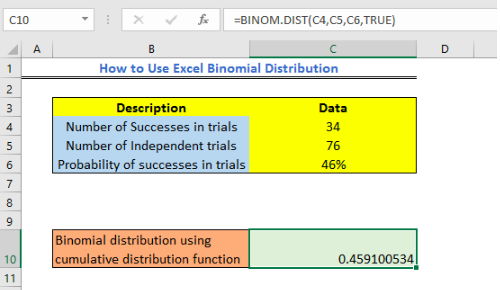 Figure 4 – Binomial distribution using Cumulative Distribution Function
2. Now, we will calculate the binomial distribution using probability mass function
b. We will enter the description in Cell B11 and insert the formula below in Cell C11
=BINOM.DIST(C4,C5,C6,FALSE)
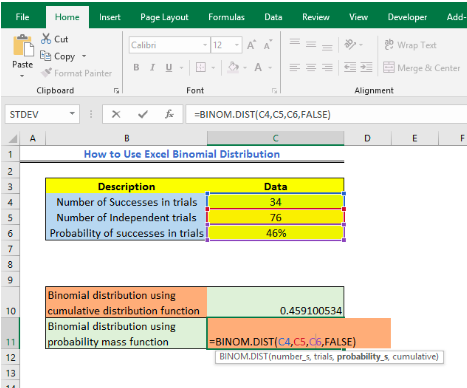 Figure 5 – Using the BINOM.DIST function
- We will get the result below
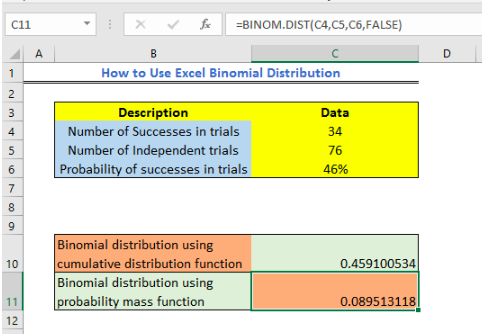 Figure 6 – Using Probability Mass Function for Binomial distribution
Note
We can get one of these errors when carrying out the Excel Binomial function
- #VALUE – this happens when the number of probability argument or trials is non-numeric.
- The BINOM.DIST is different from the BINOMDIST and can be found in Excel 2010 and higher. We use BINOM.DIST function because it has improved accuracy.
Instant Connection to an Excel Expert
Most of the time, the problem you will need to solve will be more complex than a simple application of a formula or function. If you want to save hours of research and frustration, try our live Excelchat service! Our Excel Experts are available 24/7 to answer any Excel question you may have. We guarantee a connection within 30 seconds and a customized solution within 20 minutes.


Leave a Comment